Lupine Publishers Group
Lupine Publishers
Menu
ISSN: 2637-6652
Research Article(ISSN: 2637-6652) 
The Potential Use of SARAL ALTIKA Towards Coastal Regions - A Case Study on East Coast of India Volume 1 - Issue 4
PSN Acharyulu1*, Prasad K V S R1, Vignudelli Stefano2 and Rashmi Sharma3
- 1Department of Meteorology and Oceanography, Andhra University, India
- 2Consiglio Nazionale delle Ricerche, Istituto di Biofisica, Pisa, Italy
- 3Space Applications Centre, Atmospheric and Oceanic Sciences Group, Ahmedabad, 380 015, Gujarat, India
Received: May 09, 2018; Published: May 21, 2018
Corresponding author: PSN Acharyulu, Department of Meteorology and Oceanography, Andhra University, India
DOI: 10.32474/MAOPS.2018.01.000120
Abstract
Altimeter data provides a precise measurement of wave parameters especially over open ocean. Now, several attempts were made to retrieve wind and wave information towards coastal regions. SARAL/Altika is a first of its kind to operate at such a high frequency to provide better observation of coastal regions. The present study is especially important for the Indian coasts because most of the in-situ observations are either coastally located or at deep water. But there is no sufficient information on data available at intermediate waters, which is very important to addresses several coastal problems. In this paper, an attempt to observe retrieve and validate SARAL along track wave data at different coastal regions along the east coast of India. SARAL validation is carried out at the point closest to the buoy and at all the points along the track close to the coast. The narrow foot print size enables.com to get valid data as close as three km proximity to the coast. SARAL Significant wave height (SWH) estimates are well correlated with the coastal buoy measurements and improves observation of wave height estimates close to the coast. This helps.com to understand transformation of wave from deep water to shallow water. An important advantage of SARAL is better estimation of low wave heights, which is particularly important for the coastal regions along east coast of India especially during non-monsoon periods particularly during the months of January and February. Another important observation from the study was the orientation of the coast and altimeter flight path will also have an effect on altimeter measurement of wave heights particularly over the coastal regions. The seasonal distribution of mean wave climate data prepared from SARAL Altika with a time span of 3 years (April 2013 to March 2016) with one fourth degree resolution. The distribution of significant wave height over west Bay of Bengal displays a seasonal behavior and the impact of monsoon winds. It also displays a zonal character.
Keywords: Satellite Altimetry; Coastal Zone; Coastal processes; Significant Wave Height; Seasons; Low pressure systems.
Introduction
Bay of Bengal is one of the most dynamic seas in the world. It undergoes dynamic seasonal behavior during South West (SW) and North East (NE) monsoons and having transition period of calm sea along with violent cyclones in between them. Due to this, it has a huge contrast in wind wave parameters. Wind wave plays a major role in alteration of the coastal dynamics especially along the east coast of India. So, it is important to monitor and observe wind wave parameters over the Bay of Bengal. In most of the cases, a continuous data of these parameters were not available. Even though In-situ observations provide information on a point scale but they are not continuous and synoptic information (sometimes) was not available for most parts of Indian coast. Satellite remote sensing especially radar altimeter provide a unique and simultaneous view over large expanses of the ocean and provide repeated observations with extensive geographic coverage. By analyzing the shape of the return pulse, precise and low noise measurements of the significant wave height and wind speed can be obtained from radar altimeter (Walsh 1979). Both in temporal and spatial scales radar altimeter serves as best alternative source for the measurement of short period waves (Krogstad & Barstow 1999).
Numerous studies on calibration and validation of altimeter data was performed by (Challenor et al. 2006; P. G. Challenor & Cotton 2002; Janssen et al. 2007; Kumar et al. 2013; Queffeulou 2004; Queffeulou 2000; (Zieger et al. [1]); (Durrant et al. [2]); (Ray & Beckley [3]); B G Reguero et al. 2012; Young 1998) both in temporal and spatial scales either by making global statistical analysis or by cross validation at same time and location. Study of altimetry is well established over Open Ocean but its difficulty lies in extending its application to coastal regions, (Vignudelli et al. [4]). So far altimeter measurements of SWH were ignored in coastal regions at least 50 km, where sea state conditions can be very different from the coastal region because of the land contamination in the altimeter foot print (Sepulveda et al. [5]).With special processing and careful screening valid SWH data can be obtained from altimeter in the coastal region of 0-50 km (Passaro et al. [6]). Several efforts were made over the last decade to improve the quality of the altimetry data close to the coasts. Developing new retracking algorithms, improvements in corrections and coastal dedicated projects like COASTALT (Gómez Enri 2008), PISTACH (Mercier et al. 2010), e-Surge (ALES (Passaro et al. [4]), PEACHI (Valladeau 2015) etc., and also a series of COASTALT workshops made significant improvement in extending altimeter data from open ocean to the coastal zone (Cipollini et al. [6]). As a part of progress in satellite altimetry, SARAL/Altika launched on 25 February 2013 an Indo French collaborative project is a first of its kind to operate at such a high frequency of 35 GHz to provide better observation of coastal regions as one its main objectives. More detailed description of the mission was provided by (Verron et al. [7]). The narrow foot print size enables.com to get valid data very close to coast. But the main disadvantage of SARAL is its sensitivity to the clouds and rain (Tournadre et al. [8]). Study of wind and wave parameters in the coastal areas was one of the main challenges of the present decade (Sepulveda et al. [5]). Earlier, the global validation of SARAL SWH data was performed by Queffeulou 2013a. Also they revealed the impact of rain events on quality of SWH estimates from SARAL. (Hithin et al. [9]) carried out SARAL wave comparison in the coastal ocean and inland water bodies and observed highly consistent performance of SARAL in the three tropical oceans. (Jayaram et al. [10]) inferred the good quality of the SARAL products over north Indian Ocean. In the present paper, an attempt to observe retrieve and validate high resolution along track SARAL derived wave heights in the Bay of Bengal along with In-situ observations and to assess the capability and potential application of SARAL along the coastal zones of east India.
Data and Methods
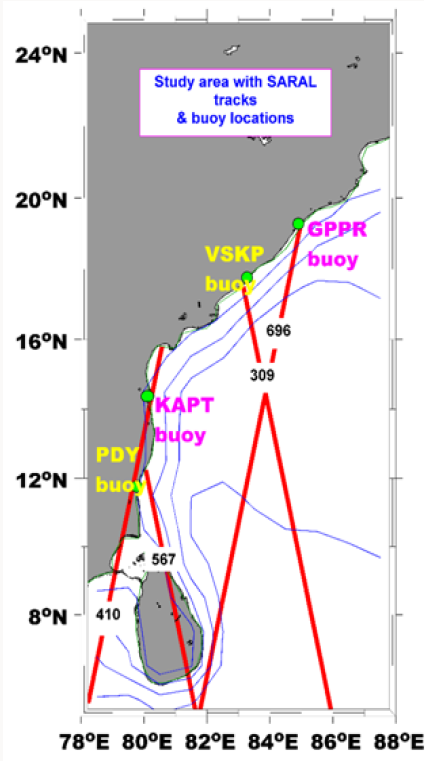
Study area: The study area comprises of four stations all along the western Bay of Bengal off east coast of India. The abutting east coast of India has a complex coastline with almost parallel bathymetry contours offshore plotted using GEBCO data and the adjoining sea, Bay of Bengal is the largest bay in the world is as shown in the (Figure 1). The study region was influenced by three different conditions during a year. They are Southwest monsoon SW (June to September), Northeast monsoon NE (December to February) and a transition period in between these two seasons. Low pressure systems and often severe cyclones also develops during the transition period also influences the study area.
In-situ data: Wave data is routinely measured in the study region by Indian National Center for Ocean Information Services (INCOIS) operated by the National Institute of Ocean Technology (NIOT). The more detailed description of the in-situ buoy is available in INCOIS website (http://www.incois.gov.in). The data was obtained from February 2013 to May 2016 for a period of about 3.25 years. The buoy data is a point observation of wave parameters located off Gopalpur, Visakhapatnam, Pondicherry and CB 05 coastal station off Krishnapatnam Port within the distance of 20 km away from the coast except at Pondicherry at a distance of 35 km. The data collected from the buoy are the quality controlled temporal sampling of wave measurements computed with half an hour interval and the reference being a benchmark connected to the national datum. The significant wave height (SWH), Wave period (mean and peak) and Wave direction are thus computed within the time span of half an hour.
Altimeter data: SARAL along-track Intermediate Geophysical Data Records (IGDR) and Geophysical Data Records (GDR) data are obtained from the AVISO (Archiving, Validating and Interpretation of satellite oceanographic data) website (www.aviso.oceanobs.com) through ftp service. The SARAL ground tracks (or passes) selected for the study region are 309, 410, 567, 696 with 35 day repeat cycle passing over Visakhapatnam, Krishnapatnam, Pondicherry and Gopalpur coasts respectively. High frequency SARAL IGDR 40Hz data was used for the present study. The study period covers SARAL repeat cycles from cycle 01 to cycle 34. No specific editing was performed on the SARAL data except land ocean flag. In order to study the coastal wave conditions, Instead of collocation, closest point analysis and along-track analysis methods were chosen for the present study. In these methods, the comparisons or validations were carried out at the closest (or) the shortest point was carried out. This method is very useful especially in coastal regions to understand the extent of altimeter data validity proximity to the coast and also to study coastal wave variability.
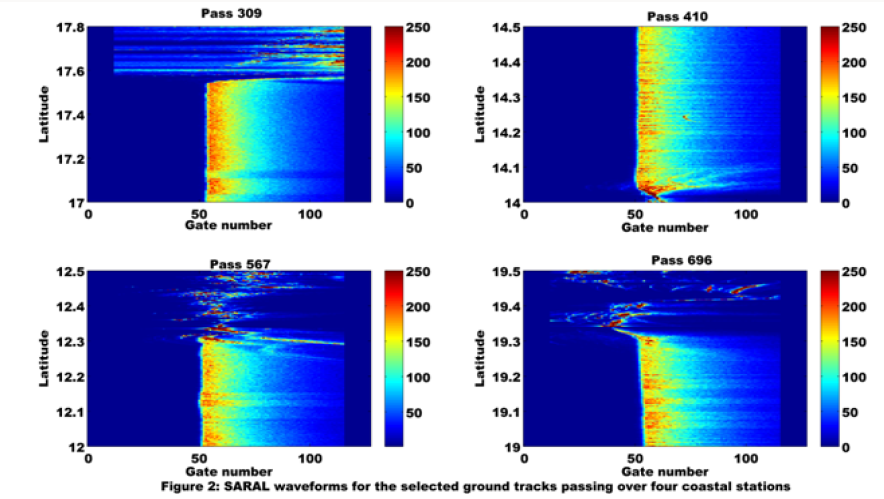
SARAL waveforms/radar grams over coastal regions on east coast of India: A short pulse of radiation with known power interacts with the sea surface and a portion of transmitted pulse returns back to satellite. Along with the echo, the two ways travel time and shape of the return pulse was also recorded in the satellite. The varying power of the return signal is called ‘waveform’. The two ways travel time has a span of 3.125ns for each gate. Each individual echo was averaged over certain frequency to minimize the speckle noise. This averaged waveforms achieve high frequency upto 20Hz. But in SARAL this high frequency data sampling was up to 40 Hz due to its high frequency Ka band(Passaro et al. [4]), (Quartly et al. [11]). The satellite radar altimeter can be able to provide precise, less noise measurements of the significant wave height of ocean waves by analyzing the shape of the return pulse (Walsh, 1979). The SARAL waveforms for the selected ground tracks passing over different coastal stations were shown in (Figure 2). SARAL ground track 309 to check the validity of the SARAL proximity to the coast. The reason for selection of this particular track is that it is passing nearly perpendicular to the coast so the distance to the coast can be easily computed (not shown in this paper). In the last few km from the coastline the waveform shape changes from that expected homogeneous surface for both coastal waters and elevated land can give returns within the altimeter’s range window (Passaro et al. [4]). The SARAL waveforms are homogenous up to ~ 3km close to the coast (Prasad et al. [12]). So using SARAL, we can obtain wave information as close as 3km up to the coast over the east coast of India. The SARAL waveform for the ground tracks 410 passing off Krishnapatnam Port. The SARAL waveform for the ground track 567 passing offshore of Pondicherry. The SARAL waveform for the ground track 696 passing close to Gopalpur
Figure 2: SARAL waveforms/radar grams for the tracks passing along four coastal stations along the east coast of India.
Results and Analysis
In the present study, all the comparisons were made using the closest point analysis (Passaro et al. [4]). This method is extremely useful in minimising the error in comparison between altimeter and In-situ buoy measured wave data especially in the coastal zone because in the coastal zone, the wave transforms as deep water wave to shallow water wave. So the distance and time in the coastal zone should be as small as possible. Also this method minimises the differences in observation of altimeter and In-situ buoy than the collocation method. But the main disadvantage is less in availability of number of observation points.
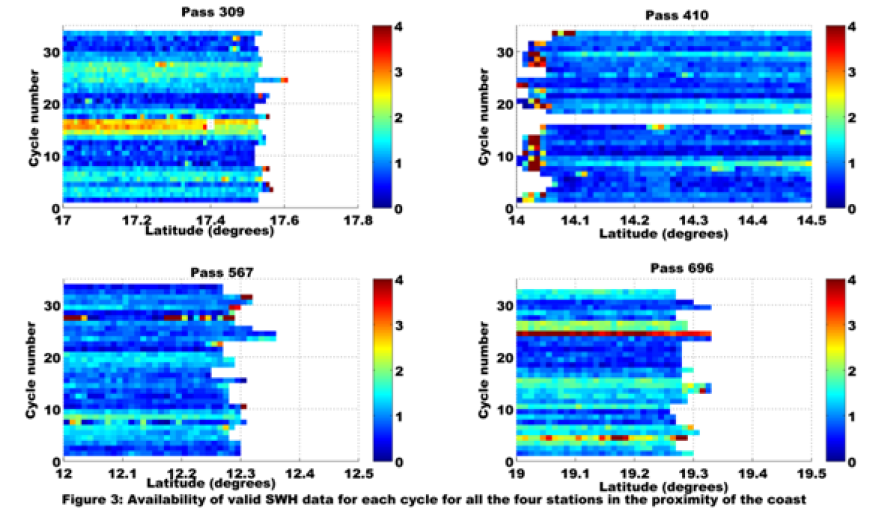
Availability and validity of SARAL SWH data over the coastal regions: Many studies (Tournadre, Girard Ardhuin, & Legrésy, 2012) Gomez Enri (2010) and Scozzari, Gomez-Enri, Vignudelli, & Soldovieri (2012) related to identification of physical features that appear in waveforms due to presence of vivid targets like detection of small ships, ice bergs and even exposure of tidal flats were still in its early stage and a subject matter of debate. Using COASTALT wave data (Caballero 2011) retrieved wave information from Jason-2 as close as 8-9 km to the coast. SARAL is ka band altimeter with less foot print size than other conventional altimeters. Also SARAL has a high sampling rate of 40Hz. This high resolution along-track data set contains physical information close to the coast. In this present study, four coastal stations all along the east coast of India for extensive study, comparison and validation of wave heights in the coastal zone. (Figure 3) shows the availability of valid SWH data for each cycle for all the four stations in the proximity of the coast. It also shows that the availability of valid SWH data is not constant for each cycle and it varies for each cycle. Tournadre [13] observed similar observation and the presence of varying patches of high reflectance and they are most likely related to sea state generated by unbroken wave crests and patches of calm water.
Figure 3: Availability of valid SWH data for each cycle for all the four coastal stations along the east coast of India.
Validation of SARAL data over the coastal regions:
In this section, the validation of SARAL data with coastal buoys was presented for the coastal regions along east coast of India. Correlation coefficient (r), RMSE and bias parameters were used to check the data quality and for validating the SARAL SWH data at the closest altimeter- buoy pair for closest point analysis and along all the track points close to buoy in the vicinity of the coast for a longtrack analysis. Validation is carried out using two different analyses, the closest point analysis and along-track analysis for the four coastal stations using data availability. The coastal topography has a significant impact on coastal measurements especially proximity to the coast.
Closest point analysis : The closest point analysis was performed on two tracks 309 and 696 passing off Visakhapatnam and Gopalpur locations due to availability of sufficient In-situ data. The details of the data available for the study were provided in (Table 1). The time series and scatter plot comparison of the tracks 309 and 696 were shown in (Figures 4a & 4b). Both the SARAL tracks 309 and 696 were passing along the central east coast of India. The SARAL track 309 passing between the two ports namely Gangavaram and Visakhapatnam ports. The extraction of SWH for the track 309 was particularly important because the track passes almost perpendicular to the coast. Thus it helps.com in easy computation of distance to the coast. This in turn helps.com to observe the availability of SARAL data proximity to the coast and it was observed to be around 3 km close to the coast (not presented in this paper). The SARAL track 696 was passing along Gopalpur port with closest SARAL buoy pair at 3km away from the coast.
The SARAL track 309 is a land to ocean track and track 696 is an ocean-to-land track. The time series comparison shows that SARAL provides wave height estimates in the coastal region. Also low wave height estimates are better observed in the SARAL data, which is a very important observation particularly for the present study region. As this this study region is subjected to low wave heights during non-monsoon periods particularly during January and February. The scatter plot shows that the data is in good agreement with the INSITU data. The comparison statistics were presented in (Table 2). The statistics suggests that the correlation scales were higher than 90% at both the stations. RMSE and bias values are also in acceptable range. The RMSE values are higher at Gopalpur than at Visakhapatnam even though the altimeter buoy pair distance is closer at Gopalpur than Visakhapatnam. There is a good correlation of SWH estimates in the coastal regions.
Figure 4: a. (upper panel) Time series comparison plots of SWH for SARAL ground track 309 and 696 with buoy data. b. (Lower panel) Scatter plots of the SARAL tracks 309 and 696 with buoy data.
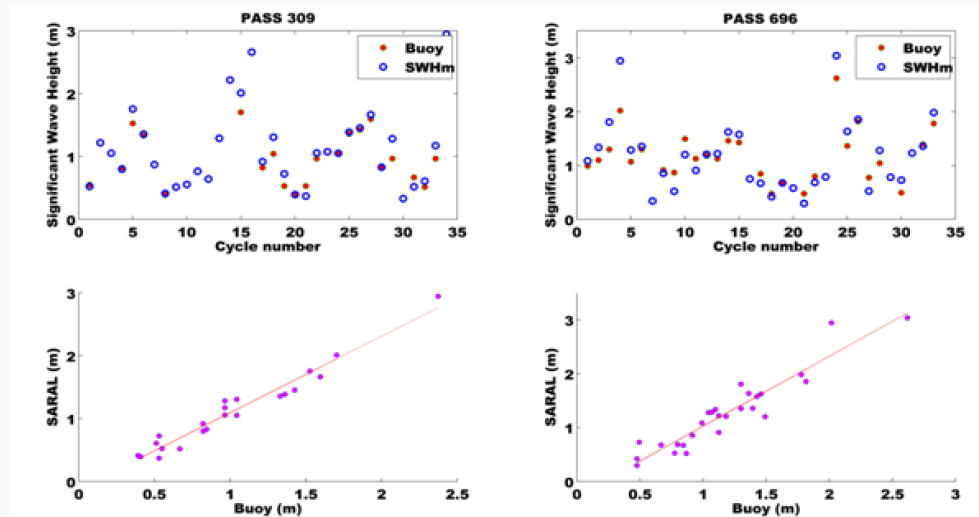
Table 1: Row 1: Data availability for this study, Row 2: the wave rider buoy to which the tracks specified in each column are compared, Row 3: Minimum distance between the wave rider buoy and the closest point on each satellite track, Row 4: the number of SARAL cycles utilized for the present study, Row 5: the number of cycles where no in-situ/Satellite data was available, Row 6: the closest latitude location of validation.

Table 2: List of cycles. Column2: list of the cycles used in this study for each satellite track. Cycles where satellite data were missing and/or coincident wave data were not available have been excluded. The square brackets indicate the range of cycles including the extremes. Column 3: time interval in day/month/year format.

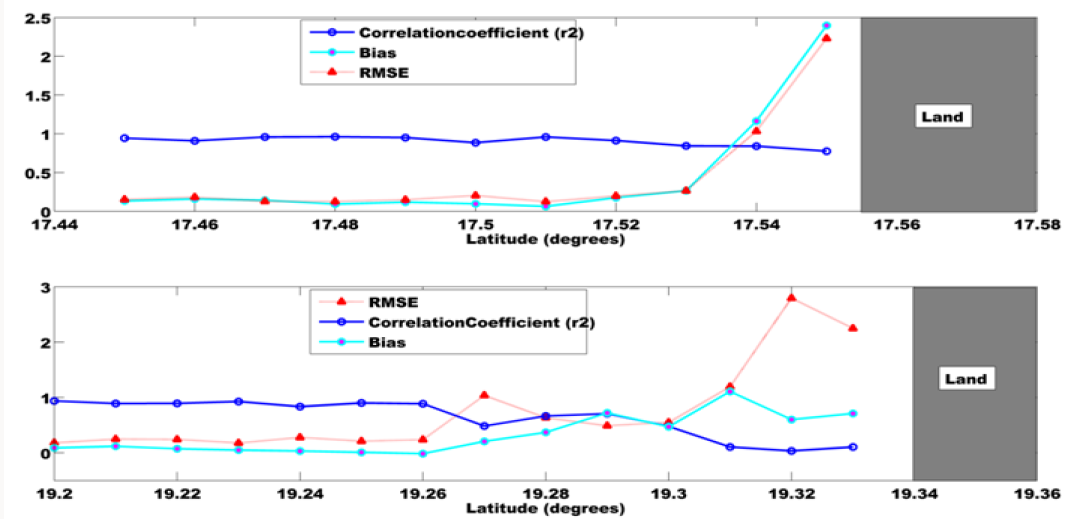
Along Track Comparison: First, the validation test was performed on tracks 309 and 696 passing off Visakhapatnam and Gopalpur. The validation of these SARAL tracks were particularly important because of their strategic location on the center of the east coast of India. Also the availability of the sufficient in-situ data for comparison purpose. The test was performed in an iterative way, for each location, the correlation, RMSE and bias of the Buoy time series with corresponding set of altimetry retrievals was checked. For each location, in order to produce an unbiased comparison, correlation, RMSE and bias were considered only when both Buoy and SARAL estimates are available (Figure 5). Show the along track spatial variation of correlation, RMSE and bias for the tracks near Visakhapatnam and Gopalpur. Land shown is in grey. The x-axis represents the along track progression of each track in latitude. The latitude of the Wave rider buoy was represented as a black dot. Blue line represents correlation coefficient while cyan lines represent bias and the red lines represent the RMSE of the dataset. Here SARAL data shows good correlation as close as 3 km proximity to the coast and the correlation values decreases significantly while approaching towards coast. For the descending land to sea SARAL track 309, the correlation constantly maintains over 0.8 maintains up to latitude 17.54 and then decreases to 0.77 towards coast while the maximum correlation observed was 0.96. The RMSE fluctuates constantly around 0.15m with few peaks around 0.2m upto latitude 17.53 and then sharp increase to over 1m towards coast. Similarly the bias values were also under 0.2m up latitude 17.52 and slightly increases to 0.26 at latitude 17.53 and then there is sharp increase to over 1m towards coast. The lowest bias observed was 6cm a similar value was observed by (Hithin et al. [9]). The better statistics like correlation, bias and RMSE was obtained at latitude 17.48 but here it is important to observe that the valid SWH data is available up to latitude 17.53 which is around 2.5 to 3 km proximity to the coast. For the ascending sea to land SARAL track 696, the correlation constantly maintains over 0.8 upto latitude 19.26 and then decreases towards coast with a single peak at latitude 19.29 while the maximum correlation was observed at latitude 19.2. However it is important to observe that the valid SWH data (r2=0.8) was available upto 17.29, which is around 2-3 km close to the coast. The RMSE values were around 0.2-0.25m with peak around 0.3m up to latitude 19.26. Later, it abruptly increases to 1m at latitude 19.26 and then decreases to around 0.5m and then increases over 1m towards close to the coast. The bias values around 0.2m were gradually decreases and becomes negative bias at latitude 19.26 and then gradually increases to over 1m with two peaks towards coast.
Figure 5: Shows the along track spatial variation of correlation, RMSE and bias for the tracks near Visakhapatnam and Gopalpur.
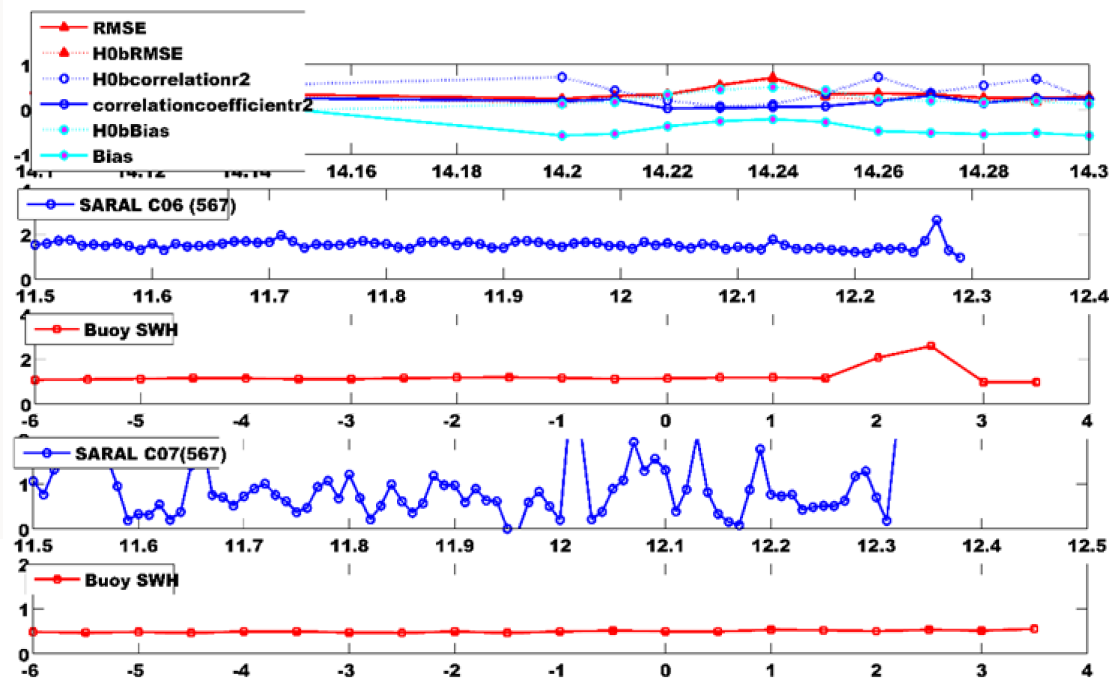
The validation of SARAL track 410 and 567 was problematic due to non-availability of sufficient in-situ data and particularly due to bay type orientation of the adjoining coast. Also the data available was a bit far away from the coast. So here the comparison of these tracks involves special attention. The along track comparison of the SARAL tracks 410 and 567 was shown in Figure 6. For the ascending (land to sea) SARAL track 410, the comparison statistics were poor especially the correlation. The maximum correlation (r2) obtained was 0.3 at latitude 14.27. But, here interestingly it was observed that the SARAL track 410 data show good correlation with wind sea (Hm0b). This shows that the dominance of sea over this region was observed. The maximum correlation observed was 0.72 at latitude 14.26. The reason for this might be due to SARAL track 410 passing almost parallel to the coast and due to bay type orientation of the coast. It is because, an ocean wave comprise of wind sea is locally generated wave and swell, wave coming from far distances will approach the coast in an almost parallel to the coast with little effect on local seas. Here this particular SARAL track 410 is passing almost parallel to the coast. This suggests that orientation of the coast and altimeter flight path will have effect on altimeter measurement of wave heights (in this case SARAL). This is also an important observation from the study. For the descending (land to sea) track 567, the comparison of SARAL and in-situ data was more difficult with only two cycles of data available for comparison. So, here the comparison is made in such a way that the SARAL track 567 for the cycles 6 and 7 and the corresponding buoy data with six hours before and four hours after the closest time as shown in Figure 6 were considered for comparison. This method of comparison was previously made by (Prasad VSR et al. [14]) by comparing the wave height estimation of along track Jason-2 data during Laila cyclone on Visakhapatnam coast. This method of comparison was especially useful during extreme event studies. The SARAL is able to pick up the ocean signal which is also evident in the buoy data. Here, the SARAL data seems to be matching well with the in-situ data especially for the cycle 06 from latitude 12.1 to 12.3
Figure 6: Scatter plots of different spatial filters for RED3 as well as OCE3 re-trackers with Insitu data for the track 155.
Seasonal climatology of the mean significant wave height from SARAL: SARAL launched on 25 February 2013 successfully completed more than three years on board enables to prepare ocean wave climatology and to study monthly and seasonal distribution of wave variability as well as inter-annual variations about mean and maximum heights, which are of foremost importance to shipbuilding and offshore structures and several other coastal activities. The seasonal mean wave climate was prepared using SARAL data from April 2013-March 16 (3years) as shown in Figure 7. The data criteria were used for the generation of maps was presented. The distribution of significant wave height over west Bay of Bengal displays a seasonal behavior and the impact of monsoon winds. It also displays a zonal character. Clearly, the summer monsoon dominates the year with high waves reaching as high as 3m approaching from south (south Indian Ocean). A large band of high waves coming from south Indian Ocean and gradually decreases as it approaches towards North West Bay of Bengal and spreads all over the bay of Bengal while the maximum lies in lower latitudes. In the winter months, a large band of waves (less than summer monsoon) with height of around 2m extends like a tongue from southern Indian Ocean to central east coastal India. Both Premonsoon and post monsoon seasons high waves disappear and swells coming from southern Indian ocean dominates with signs of cyclonic storms. During all seasons the Sri Lankan Island serves as barrier for the waves coming from the south. These two seasons were served as transitional periods between the summer and winter monsoon (Table 3).
Figure 7: Seasonal climatology of the mean significant wave height, Hs, along east coast of India, derived from 3 years of SARAL data from 04/2013 – 03/2016 with 0.25° longitude x 0.25° latitude grid. The color scale is in meters. (a) Jun, Jul, Aug, Sep (b) Mar, Apr, May (c) Dec, Jan, Feb (d) Oct, Nov.
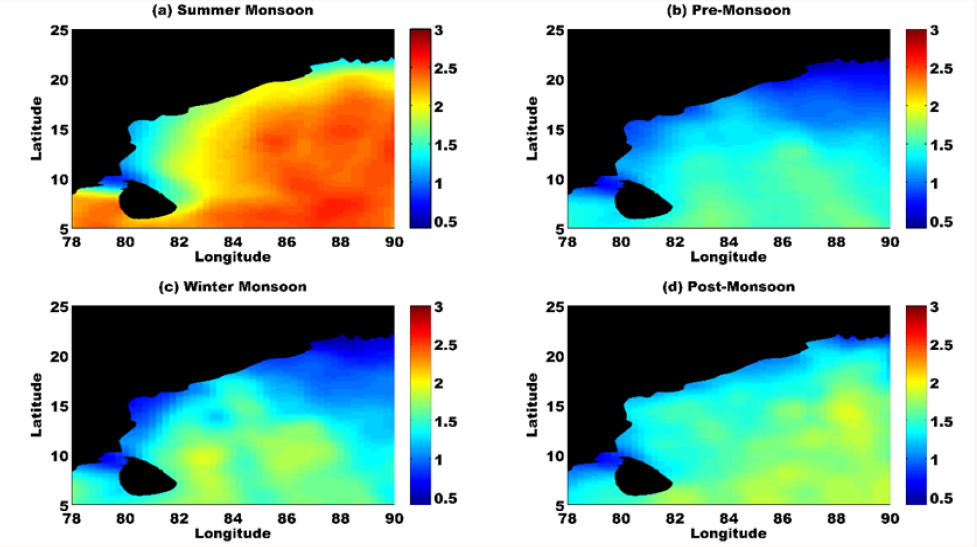
Table 3: Validation results. Row 1: SARAL track number, Row 2: correlation coefficient R2 of SWH for each track with the correspondent buoy wave heights, Row 3: Bias of SWH for each track with the correspondent buoy wave heights, Row 4: RMSE of the difference of the SWH at the closest point between buoy and SARAL tracks.

Conclusion
SARAL is the first of its kind to provide wave observations in the proximity of the coastal regions due to its narrow foot print size. The present study focusses on the availability and validation of SARAL SWH data in the coastal regions of east coast of India. The scope for improvement of this paper lies in better detection of outliers in order to obtain better statistics proximity to the coast. Also by obtaining data over more locations and time span more consistent results would be achieved. The SARAL radargrams over different coastal regions show that ocean information can be retrieved close to the coast also. Also different SARAL tracks reveal the availability of valid SWH measurements close to the coast. The validation of SARAL SWH data was performed at the point nearest to the buoy and at all points along the track. The SWH estimates from SARAL and in-situ are well correlated in the proximity of the coast at different coastal stations. SARAL improves and extends observation of wave height estimates close to the coast also. Thus, SARAL provides wave height estimates in the coastal region as close as 3km proximity to the coast. Also the wave data obtained from the conventional altimeters during the calm season were not reliable because of wave heights were so small that will fall within the accuracy of the instrument and provides better correlation of higher wavelengths. But, SARAL enables more accurate measurement of the backscatter coefficient over calm or moderate seas. As the coastal regions of east coast of India are subjected to very low wave heights during non-monsoon periods especially during January and February. An important advantage of SARAL is better estimation of low wave heights, which is particularly important for the coastal regions along east coast of India. Another important observation from the study was the orientation of the coast and altimeter flight path will also have an effect on altimeter measurement of wave heights particularly in the coastal regions. The distribution of significant wave height over west Bay of Bengal displays a seasonal behavior and the impact of monsoon winds. It also displays a zonal character. SARAL data helps.com to study shallow water wave characteristics. This study is especially important because there is no sufficient number of observations in the coastal regions. This helps in understanding variability of wave heights from deep to shallow water and helps to understand wave transformations like refraction, shoaling and other coastal processes. Also the wave data obtained from the conventional altimeters during the calm season were not reliable because of wave heights were so small that will fall within the accuracy of the instrument and provides better correlation of higher wavelengths. But, SARAL enables more accurate measurement of the backscatter coefficient over calm or moderate seas.
Acknowledgement
The authors express our sincere acknowledge Space Applications Center (ISRO) for providing financial support during this work. We express our sincere gratitude to INCOIS and AVISO for providing the buoy and altimeter data and their constant support. We would like to thank Prof. B.S.R Reddy, Raj Kumar and RM Gairola for their support and encouragement.
References
- Zieger S, Vinoth J, Young IR, (2009) Joint calibration of multiplatform altimeter measurements of wind speed and wave height over the past 20 Years. Journal of Atmospheric and Oceanic Technology 26(12): 2549- 2564.
- Durrant TH, Greenslade DJM, Simmonds I (2009) Validation of Jason-1 and Envisat remotely sensed wave heights. Journal of Atmospheric and Oceanic Technology 26(1): 123-134.
- Ray RD, Beckley BD (2012) Calibration of Ocean Wave Measurements by the TOPEX, Jason-1, and Jason-2 Satellites. Marine Geodesy 35(sup1): 238-257.
- Passaro M, Paolo Cipollini, Stefano Vignudelli, Graham D Quartly, Helen M Snaith (2014) ALES: A multi mission adaptive subwaveform retracker for coastal and open ocean altimetry. Remote Sensing of Environment 145: 173-189.
- Sepulveda HH, Queffeulou P, Ardhuin F (2015) Assessment of SARAL/ AltiKa Wave Height Measurements Relative to Buoy, Jason-2, and Cryosat-2 Data. Marine Geodesy 38(sup1): 449-465.
- Passaro M, Fenoglio Marc L, Cipollini, P (2015) Validation of significant wave height from improved satellite altimetry in the German Bight 53(4): 2146-2156.
- Verron J, et al. (2015) The SARAL/AltiKa Altimetry Satellite Mission. Marine Geodesy, 419(February) 00–00.
- Tournadre J, Lambin Artru J, Steunou N (2009) Cloud and rain effects on AltiKa/SARAL ka band radar altimeter - part II: Definition of a rain/ cloud flag. In IEEE Transactions on Geoscience and Remote Sensing 47(6): 1818-1826
- Hithin NK, PG Remya, TM Balakrishnan Nair, R Harikumar, Raj Kumar, et al. (2015) Validation and Intercomparison of SARAL / AltiKa and PISTACH Derived Coastal Wave Heights Using In-Situ Measurements. IEEE JOURNAL OF SELECTED TOPICS IN APPLIED EARTH OBSERVATIONS AND REMOTE SENSING 8(8): 4120-4129.
- Jayaram C, Saurabh Bansal, A Sai Krishnaveni, Neethu Chacko, VM Chowdary, et al. (2016) Evaluation of SARAL / AltiKa Measured Significant Wave Height and Wind Speed in the Indian Ocean Region. Journal of the Indian Society of Remote Sensing 44(2): 225-231.
- Quartly GD, Srokosz MA, McMillan AC (2001) Analyzing altimeter artifacts: Statistical properties of ocean waveforms. Journal of Atmospheric and Oceanic Technology 18(12): 2074-2091.
- Prasad PKVSR, Acharyulu PSN, Sharma R, (2014) Contribution of Satellite Altimetry in providing Wind wave information in coastal regions of East coast of India.
- Tournadre J (2007) Signature of Lighthouses, Ships, and Small Islands in Altimeter Waveforms. Journal of Atmospheric and Oceanic Technology 24(6): 1143-1149.
- Prasad VSR K, Acharyulu PSN, VV Arun Kumar S (2012) Application of Altimetry in assessing extreme winds and waves during cyclone period - a case study of LAILA cyclone. In Pan Ocean Remote Sensing Conference(PORSEC)-2012, Kochi, India.

Top Editors
-

Mark E Smith
Bio chemistry
University of Texas Medical Branch, USA -

Lawrence A Presley
Department of Criminal Justice
Liberty University, USA -

Thomas W Miller
Department of Psychiatry
University of Kentucky, USA -

Gjumrakch Aliev
Department of Medicine
Gally International Biomedical Research & Consulting LLC, USA -

Christopher Bryant
Department of Urbanisation and Agricultural
Montreal university, USA -

Robert William Frare
Oral & Maxillofacial Pathology
New York University, USA -

Rudolph Modesto Navari
Gastroenterology and Hepatology
University of Alabama, UK -

Andrew Hague
Department of Medicine
Universities of Bradford, UK -

George Gregory Buttigieg
Maltese College of Obstetrics and Gynaecology, Europe -

Chen-Hsiung Yeh
Oncology
Circulogene Theranostics, England -
.png)
Emilio Bucio-Carrillo
Radiation Chemistry
National University of Mexico, USA -
.jpg)
Casey J Grenier
Analytical Chemistry
Wentworth Institute of Technology, USA -
Hany Atalah
Minimally Invasive Surgery
Mercer University school of Medicine, USA -

Abu-Hussein Muhamad
Pediatric Dentistry
University of Athens , Greece

The annual scholar awards from Lupine Publishers honor a selected number Read More...


