Lupine Publishers Group
Lupine Publishers
Menu
ISSN: 2637-6652
Research Article(ISSN: 2637-6652) 
Temporal and Spatial Variability of Global Upper Ocean Freshwater Content Volume 1 - Issue 5
Peter C Chu* and Chenwu Fan
- Naval Ocean Analysis and Prediction Laboratory, Department of Oceanography, Naval Postgraduate School, Monterey, USA
Received: May 21, 2018; Published: May 29, 2018
Corresponding author: Peter C Chu, Distinguished Professor, Department of Oceanography, Naval Postgraduate School, Monterey, USA
DOI: 10.32474/MAOPS.2018.01.000123
Abstract
Observational salinity data from the Global Temperature and Salinity Profile Program (GTSPP) are used to identify temporal and spatial variability of the upper ocean freshwater content (FWC). First, the optimal spectral decomposition (OSD) is used to build up monthly synoptic temperature and salinity data set from January 1990 to December 2009 on 1o×1o grids and the same 33 vertical levels as the World Ocean Atlas 2005. Then, the monthly varying upper layer FWC fields (F) with four different layer thicknesses (surface to 50, 100, 300, and 700 m depths) are obtained. Second, a composite analysis is conducted to obtain the totaltime mean FWC field ( F ) and the mean annual FWC variability ( F ), which is found an order of magnitude smaller than F . Third, an empirical orthogonal function (EOF) method is conducted on the residue data ( ˆF ), deviating from F + F , in order to obtain non-annual variability of the FWC fields. The first two EOF modes account for 63.6-76.4% and 6.7-6.8% of the variance for the four layer thicknesses, representing near-global scale (EOF-1, dominant mode) and northern-southern alternative (EOF-2, minor mode) freshening/salinization events. The near-global scale freshening/salinization has a decadal trend from salinization before 2002 to freshening after 2002. The northern-southern alternative freshening/salinization does not have evident trend.
Keywords: Global Temperature and Salinity Profile Program (GTSPP); Monthly Varying Global (T, S) Field; Optimal Spectral Decomposition (OSD); Upper Ocean Freshwater Content
Introduction
Temporal and spatial variability of the global upper ocean freshwater content (FWC) is important in climate change because the freshwater gaining from river run-off, surface freshwater flux [precipitation-evaporation (P-E)], and freshwater advection reduces upper layer salinity, stabilizes the water column, and in turn slows down the meridional overturning circulation (MOC). Numerical simulations show the responses of MOC to nearsurface salinity changes over the sinking regions with various processes generating salinity anomalies. These processes are the modification of air-sea interaction over the mid latitude and subpolar North Atlantic (in the European Centre Hamburg/Large- Scale Geostrophic model [1]), and oceanic salt transport in response to density changes in the subpolar gyre (in the Geophysical Fluid Dynamics Laboratory model[2]). The northern North Atlantic MOC stops in the Atmosphere-Ocean General Circulation Model of the Hadley Centre Coupled Model version 3 after artificially releasing a large pulse of freshwater [3]. Such MOC responses affect the global climate change.
Using regional data, Phillips and Wijffels [4] identified an average freshening of 0.2psu extending from 100oE to Australia, 25oS to Indonesia and down to 180 m depth, for more than 3 years from 1999 to 2002. Josey and Marsh [5] found freshening of the eastern half of the North Atlantic subpolar gyre over the period 1960 to 2000 from model reanalysis and observational data. The observed freshening can be largely explained as a direct response to changes in the air-sea freshwater exchange. Boyer et al. [6] obtained linear trends of zonally averaged salinity anomalies from 1955-1959 through 1994-1998 from the World Ocean Database 2001 (WOD01). They identified freshening in most of the Pacific (except in the subtropical South Pacific) and the Atlantic subpolar gyre, and shallow salinization in the Atlantic tropics and subtropics, and salinization in the Indian Ocean at all latitudes in the upper 150 meter layer, with a subsurface freshening between 40oS and the equator in the 250-1000 meter layer.
Up until now, detailed temporal and spatial variability of global upper ocean FWC has not been investigated. To fill the gap, an observational dataset from the Global Temperature and Salinity Profile Program (GTSPP) is used in this study. GTSPP has been developed since 1990 with international cooperation (see the website: http://www.iode.org/). With more observed salinity profile data especially with the Argo floats, it is possible to establish gridded salinity dataset with a sufficient resolution in space and, especially, in time using the optimal spectral decomposition (OSD) method [7-12]. From the gridded dataset, it is able to compute the upper ocean FWC and to identify its temporal and spatial variability. This paper presents such an effort and is outlined as follows. Section 2 depicts the GTSPP dataset. Section 3 presents characteristics of spatially (1o resolution) and temporally (onemonth increment) varying upper ocean FWC for four different layer thicknesses (surface to 50, 100, 300, 700 m depths) after using the OSD method. Section 4 describes the climatologically monthly mean and the total-time mean as well as the annual variability, which is an order of magnitude smaller than the total-time mean. Section 5 presents the non-annual variability (i.e., anomaly to the climatologically monthly mean) using the empirical orthogonal function (EOF) analysis. Section 6 lists the conclusions.
GTSPP
GTSPP is a cooperative international project. It seeks to develop and maintain a global ocean temperature salinity resource with data that are both up to date and of the highest quality possible. Making global measurements of ocean temperature (T) and salinity (S) quickly and easily accessible to users is the primary goal of the GTSPP. The GTSPP handles all temperature and salinity profile data. This includes observations collected using water samplers, continuous profiling instruments such as Argo floats, CTDs, thermistor chain data and observations acquired using thermosalinographs. The GTSPP went through quality control procedures that make extensive use of flags to indicate data quality. To make full use of this effort, participants of the GTSPP have agreed that data access based on quality flags will be available [13]. That is, GTSPP participants will permit the selection of data from their archives based on quality flags as well as other criteria. These flags are always included with any data transfers that take place. Because the flags are always included, and because of the policy regarding changes to data, as described later, a user can expect the participants to disseminate data at any stage of processing. Furthermore, GTSPP participants have agreed to retain copies of the data as originally received and to make these available to the user if requested. Interested readers are referred to [13], which can be downloaded from http://www.oceanobs09.net/proceedings/ cwp/cwp86/index.php.
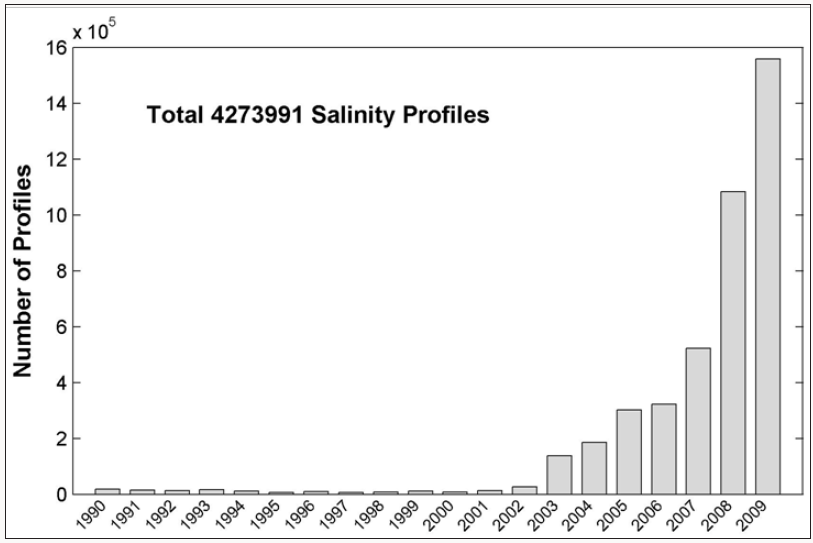
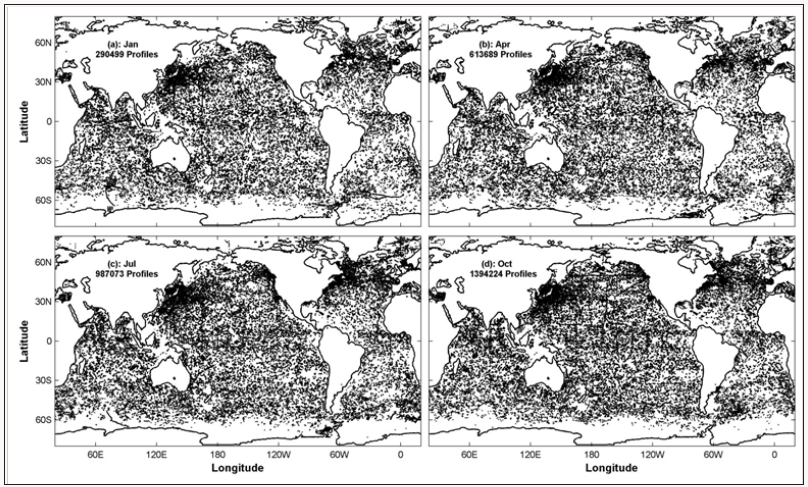
There are total 4,273,991 GTSPP salinity stations with temporally increasing data (Figure 1). The yearly number of S profiles is less than 20,000 from 1990 to 1999. Since 2000, as the Argo floats into practice, the yearly number of S profiles increases rapidly to 1.56 million in 2009. The GTSPP salinity stations are over the global ocean (Figure 2). The OSD method (see Appendix A) is used to establish 3D global gridded salinity dataset with monthly increment, 1o×1o horizontal resolution, and 33 vertical layers as the World Ocean Atlas 2005 (http://www.nodc.noaa.gov/OC5/ WOA05/pr_woa05.html), which is called as the GTSPP gridded data. The temporal and spatial variability of the global upper ocean heat content has been identified using the GTSPP data [14]. Similarly, the same GTSPP data is used here to identify the freshwater content.
Figure 2: Spatial distribution of the GTSPP salinity profiles stations during 1990-2009 for (a) January, (b) April, (c) July, and (d) October.
Gridded FWC Data
Let (x, y) be the horizontal coordinates, z be the vertical coordinate with z = 0 at the ocean surface. Let the vectors ri represent the locations of 2D horizontal grids, i = 1, 2,…, I, with I the total number of the horizontal grid points; the monthly time, p =1, 2, …, P, with P (= 240) the total number of months (i.e., total time steps). From the GTSPP gridded salinity dataset, the upper FWC (with the unit of meter) from the surface to a depth z = -h (denoted by Fh) is calculated by
Where Sref is the reference salinity. Horizontal integration of Fh(ri,∽tp) over the whole oceans leads to a time series of the globally integrated FWC
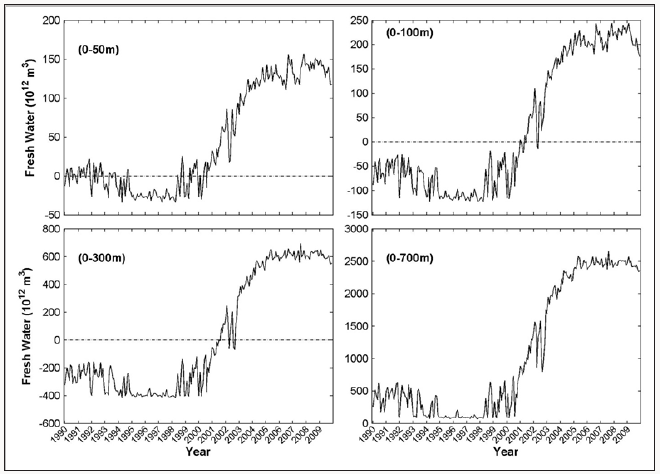
Where Ω denotes the area of the world oceans. Figure 3 shows significant FWC increases from 1999 to 2005 with fluctuations such as about 0.18×10¹⁵ m3 in the upper 50 m, 0.38×10¹⁵ m3 in the upper 100 m, 1015 m3 in the upper 300 m, and 2.5×10¹⁵ m3 in the upper 700 m. Such FWC increases occur concurrently with the increase of the global ocean heat content.
Figure 3: Temporally varying horizontally integrated global upper ocean freshwater content (unit: m3): (a) 0-50 m, (b) 0- 100 m, (c) 0-300 m, and (d) 0-700 m.
Mean Annual Variability
Two Time Averages: Let the time p t be represented by two parameters (τk, tl), Fh(ri,∽tp) ≡ Fh (ri ,τk ,tl ) , with τk = 1990, 1991, ..., 2009, the time sequence in years, and tl = 1, 2, ..., 12, the monthly sequence within a year. The climatologically monthly mean is defined by
and the total-time mean is given by
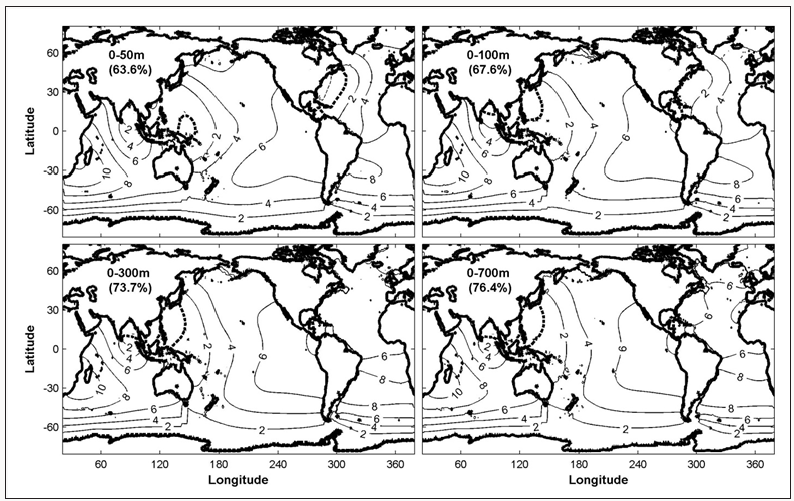
which is also called the annual mean by some authors. The total-time mean (1990-2009) of global FWC with the upper ocean depth varying from 50 m to 700 m ⚌Fh(ri) Figure 4 shows following features: The spatial characteristics of ⚌Fh(ri) are very similar as the upper layer thickness changes from 50 m to 700 m. For example, the low ⚌F300(ri) areas dominate the subtropical gyres in the world oceans with a strong salty core (<-15 m) located in the center of the North and South Atlantic subtropical gyre regions, less salty (>-10m) in the Arabian Sea, Southern Pacific, and Southern Indian subtropical gyre regions, and least salty (>0 m) in the North Pacific subtropical gyre region. The high ⚌F300(ri) areas (i.e., freshening areas) occupy the whole Southern Ocean (south of 40oS) with the FWC around 5- 12 m, north of the subtropical gyre in the North Pacific (north of 40oN) with the FWC higher than 10 m. The global ⚌Fh(ri) well coincides to the annual mean (E - P) after comparing (Figures 4-7) in [15] (see website: http://journals.ametsoc.org/ doi/full/10.1175/2011JCLI4171.1) and (Figure 3) in [16] (see website: http://wcrp.ipsl.jussieu.fr/Workshops/Reanalysis2008/ Documents/G3-391_ea.pdf) [i.e., annual mean (E-P)]. The high values of ⚌Fh(ri) correspond to low values of annual mean (E-P) and vice versa. This shows the importance of the surface freshwater flux on the upper ocean freshwater content.
Figure 4: Total-time mean (1990-2009) of global upper ocean FWC (unit: m): (a) ⚌F50(ri) , (b) ⚌F100(ri) , (c) ⚌F300(ri) , and (d) ⚌F700(ri) .
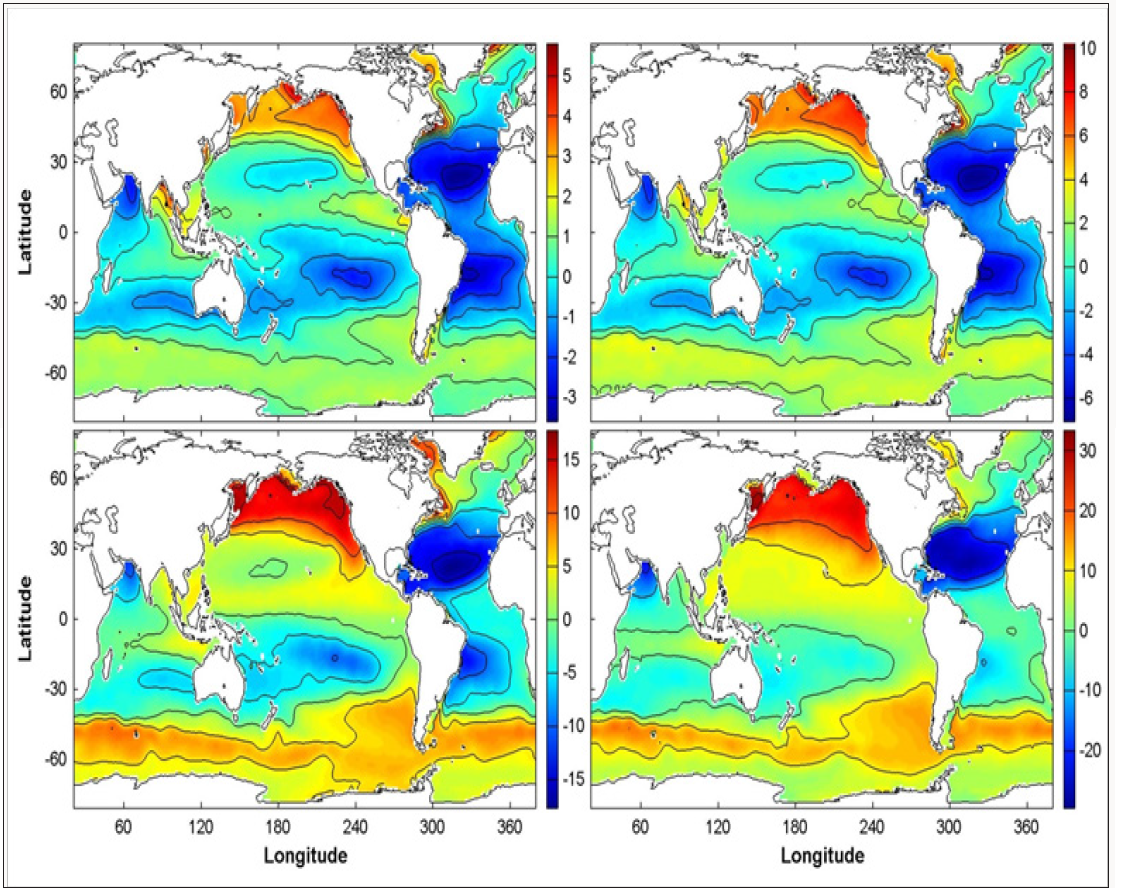
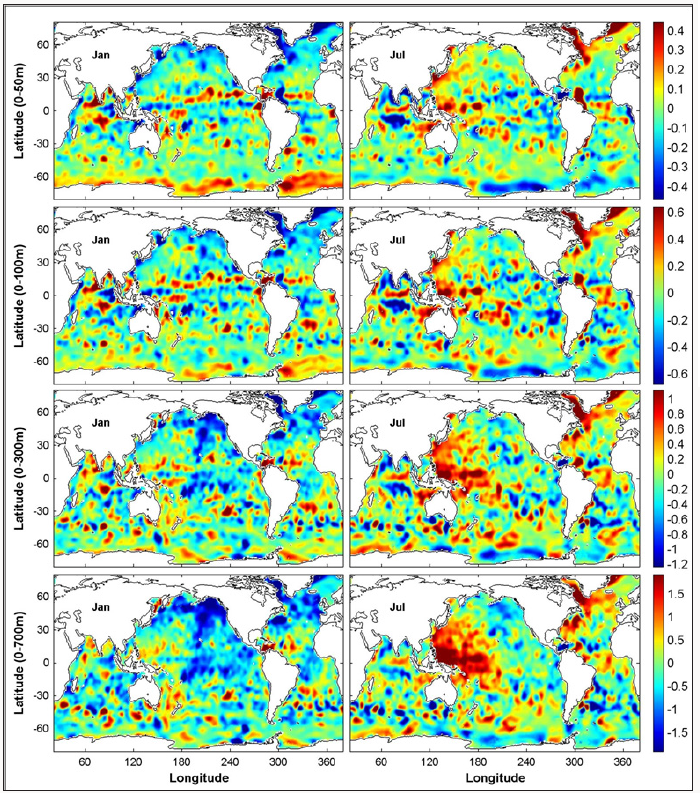
Figure 5: Mean monthly variability of upper layer F∽300(ri,tl) (upper four panels) and F∽700(ri,tl) (lower four panels: m) (a) January, (b) April, (c) July, and (d) October.
Mean Annual Variability: The annual mean values deviated from the total-time mean, ⚌Fh(ri) ,
Lead to composite features of the mean annual variability. Fig. 5 shows the following features of F∽h(ri,tl) : (1) It has maximum value around 0.4 m for F∽50 , 0.6 m for F∽100 , and 1.0 m for F∽300 , and 1.6 m for F∽700 , which is generally an order of magnitude smaller than the corresponding total-time mean ⚌Fh(ri) . (2) Its positive (freshening) and negative (salinization) values show eddy-like structure. (3) Usually, more negative (positive) values occur in the northern (southern) hemisphere in boreal winter and spring (left panels in Figure 5), and more positive (negative) values occur in the northern (southern) hemisphere in boreal summer and fall (right panels in Figure 5).
Non-Annual Variability
FWC Anomaly: FWC anomaly is the deviation from its climatologically monthly mean value
Similar to the analysis of the GTSPP temperature field (Chu 2011) [14], the EOF analysis is conducted on the FWC anomaly data
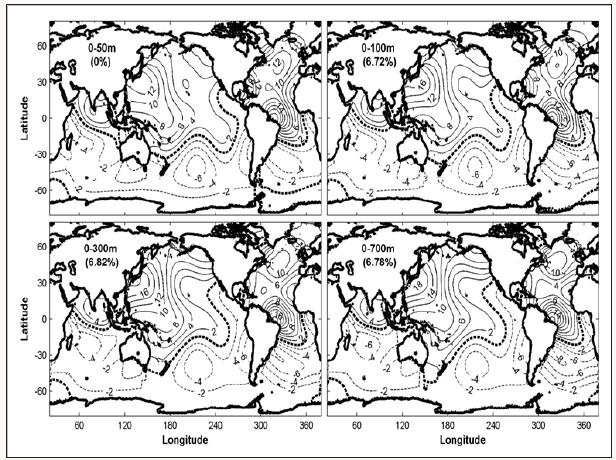
where Ej(ri) is the jth EOF mode with no unit; and PCj t∽p is the jth principal component with the unit of meter. Here, j = 1, 2, …, J; J is truncated number of the EOF modes. Table 1 shows the variance of ˆFh(ri,t∽p) r t for the first three EOFs with EOF-1containing 63.6% (for F∽50 ) to 76.4% (for F∽700 ) of variance and EOF-2 containing 6.7- 6.8% for F∽50 , F∽100 , F∽300 , and F∽700 . Here, the effort is concentrated on analyzing the first two EOF modes.
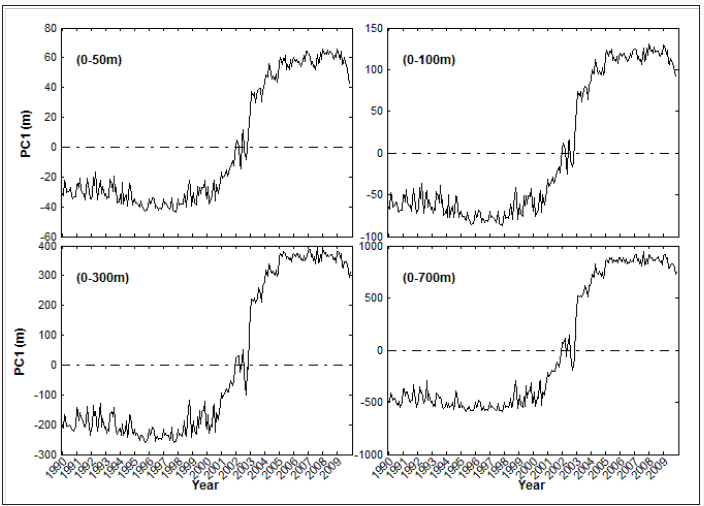
EOF-1 Mode: The EOF-1 represents the near global-scale freshening/salinization event with the similar pattern among F∽50 , F∽100 , F∽300 , and F∽700 (Figure 6). Very small areas such as the western Pacific, Bay of Bengal, and western North Atlantic (only in F∽50 ) are occupied by weak-negative values (0 > EOF-1 > -0.002) and elsewhere in world oceans are positive values (EOF-1 > 0), with a strong center located at the western Indian Ocean near Madagascar with maximum value higher than 0.01. The four time series of PC1(t∽p) for 1990-2009 (Figure 7) have very similar temporal variation with almost the same zero crossing time (at early 2002) and different spans: between -40 m to 62 m for F∽50 , -80 m to 125 m for F∽100 , -250 m to 400 m for F∽300 , and -600 m to 920 m for F∽700 . PC1(t∽p) take positive (negative) values after (before) 2012, which makes the amplitude of the EOF-1 pattern around 0.62 m in F∽50 , 1.25 m in F∽100 , 4.0 m in F∽300 , and 9.2 m in F∽700 (maximum EOF-1 is 0.01 or higher near Madagascar, Figure 6). Moreover, PC1(t∽p) has an evident upward trend from negative values (near world-oceanscale salinization) before 2002 to positive values (near worldocean- scale freshening) after 2002 and keeps high freshening since 2004.
EOF-2 Mode: The EOF-2 mode represents a latitudinal dipole structure, i.e., northern freshening (positive) – southern salinization (negative) with the similar pattern among F∽50 , F∽100 , F∽300 , and F∽700 (Figure 8). The zero-contour is from the northeast tip of the Somalian Coast (~56oE, 11oN) to the west coast of Australian at around 30oS in the Indian Ocean. It is from the east coast of Australian at around 40oS to the California Coast at around 30oN in the Pacific Ocean. It is from the Brazilian Coast around 18oS to the western African Coast near the Equator in the Atlantic Ocean. The maximum positive EOF-2 (~0.018) areas occur in the northwestern Pacific near Japan and western tropical Atlantic near the Brazilian Coast. The minimum negative EOF-2 (~ -0.006) areas occupy midlatitude southern Pacific (30oS-42oS, 20oW-50oW) and southern Atlantic (20oS-42oS, 120oW-160oW).
The four time series of PC2(t∽p) for 1990-2009 (Figures 9 & 10) have very similar temporal variation with almost the same zero crossing times with different spans: from -23 m to 44 m for F∽50 , -40 m to 90 m for F∽100 , -110 m to 280 m for F∽300 , and -240 m to 680 m for F∽700 . The maximum non-annual variation is from -0.41 m (-23 m×0.018) to 0.79 m for F∽50 , -0.72 m to 1.62 m for F∽100 , -1.98 m to 5.04 m for F∽300 , and -4.32 m to 12.24 m for F∽700 . This pattern accounts only for 6.7-6.8% of non-annual variability (see Table 1). Different from PC1(t∽p) , the second principal component, PC2(t∽p) , does not have a trend. For PC2(t∽p) 0 , the horizontal variability of FWC anomaly shows the positive phase (i.e., northern freshening and southern salinization). For PC2(t∽p)>0 , the horizontal variability of FWC anomaly shows the negative phase (i.e., the northern salinization and southern freshening). Generally, PC2(t∽p) , shows more frequent occurrence of positive values than negative values before 1994, almost all negatives from 1995 to 1999, all positive from 2000 to 2005, and almost all negative after 2005.
Figure 9: Time series of PC-2 of the FWC anomaly: (a) (a) F∽50 , (b) F∽100 , (c) F∽300 , and (d) F∽700 .
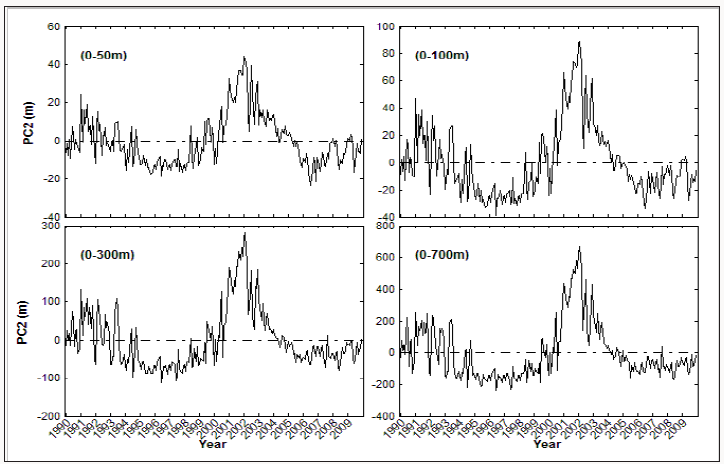
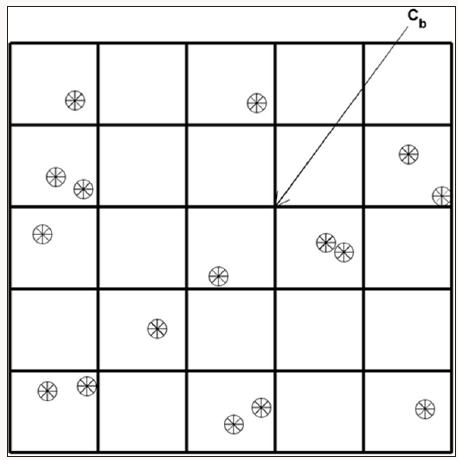
Figure 10: Illustration of ocean data assimilation with cb located at the grid points, and co located at the points ‘*”. The ocean data assimilation is to convert the innovation, d = co – Hcb, from the observational points to the grid points.
Conclusion
The major goal of this study is to identify the temporal and spatial variability in the upper ocean FWC with its possible effects on the variability of MOC. To reach the goal, a 3D global gridded salinity dataset has been established with monthly increment, 1o×1o horizontal resolution, and 33 vertical layers as the World Ocean Atlas 2005 from the global temperature and salinity profile program (GTSPP) data using the OSD method. The upper ocean FWC for the global oceans is calculated from the 3D global gridded dataset with the upper layer thickness varies from 50 m to 700 m. The composite and EOF analyses are conducted on the four FWC datasets, i.e., F50, F100, F300, and F700. The following results have been obtained:
a) The spatial patterns in the total-time mean F⚌h , mean monthly variability F∽h, the EOF modes of the FWC anomaly to the climatologically monthly mean and the temporal tendency for the globally integrated FWC, principal components of EOF modes are very similar among the four FWC datasets with various upper layer thicknesses from 50 m to 700 m. The globally integrated FWC increases significantly from 1999 to 2005 with 0.18×10¹⁵ m3 in the upper 50 m, 0.38×10¹⁵ m3 in the upper 100 m, 1015 m3 in the upper 300-m, and 2.5×10¹⁵ m3 in the upper 700 m. Such an upward trend of the global FWC is concurrent with the increase of the global ocean heat content (https://www.nodc.noaa.gov/OC5/3M_HEAT_CONTENT/ ).
b) The low total time mean FWC ( F⚌h ) (salinization) areas are associated with the subtropical gyres in the world oceans with a strong salty core located in the center of the North and South Atlantic subtropical gyre regions, less salty in the Arabian Sea, Southern Pacific, and Southern Indian subtropical gyre regions, and least salty in the North Pacific subtropical gyre region. The high total-time mean FWC ( F⚌h ) (freshening) areas occupy the whole Southern Ocean (south of 40oS), north of the subtropical gyre in the North Pacific (north of 40oN). Furthermore, the high total-time mean FWC coincides with the high annual mean (P - E) and vice versa.
c) The annual variability of FWC is an order of magnitude smaller than the total-time mean FWC ( F⚌h ) with eddy like structures. More salinization (freshening) occurs in the northern (southern) hemisphere in boreal winter and more freshening (salinization) occurs in the northern (southern) hemisphere in boreal summer.
d) The EOF analysis is conducted to analyze the FWC anomaly data (removal of total-time mean and mean seasonal variability) for the global oceans to identify low-frequency variability of the FWC anomaly. The EOF-1 (near global scale freshening/ salinization) accounts large percentage of the variance from 63.6% for F∽50 to 76.4% for F∽700 . PC1(t∽p) takes positive negative values (near global salinization) before 2012, and positive values (near global freshening) after 2012, with the maximum amplitude of the EOF-1 pattern around 0.62 m in F∽50 , 1.25 m in F∽100 , 4.0 m in F∽300 , and 9.2 m in F∽700 . Such variability due to EOF-1 is much larger than the mean annual variability. The EOF-2 (northern-southern dipole) only accounts for 6.7-6.8% of the variance, which is much less important than the EOF-1 (near global scale freshening/salinization) in the non-annual variability. The northern-southern alternative freshening/ salinization (i.e., EOF-2 mode) does not have evident trend.
Appendix A. Optimal Spectral Decomposition (OSD)
A new ocean spectral data analysis/assimilation scheme, the optimal spectral decomposition (OSD), has been recently developed to analyze ocean observational data without background and observational error covariance matrices. Existence of a lateral boundary (Г) for an ocean domain (Ω) provides a great opportunity to use a spectral method in ocean data analysis and assimilation through decomposing the variable anomaly at the grid points [ca (rn) - cb(rn)] into the spectral form,
where {ϕk} are basis functions; K is the mode truncation; and fn represents the observational contribution into the grid points. The eigenvectors of the Laplace operator with the same lateral boundary condition of (c – cb) can be used as the basis functions {ϕk}. With the spectrum (A1), the representation of the relation between the observed and grid points has been changed from the M×N background error covariance matrix B (a posteriori) to the K×N basis function matrix Φ (a priori),
This spectral method has been proven effective for the ocean data analysis. Application of the generalized Fourier series expansion (A1) to the observational points with P as the total number of observations leads to an algebraic equation
where a = (a1, a2, …, aK), is the state vector (K-dimensional) ; A is a P K matrix; Q is a P P square matrix (P > K); Y is a P-dimensional observation vector, consisting of a signal Y and a noise Y’. Due to high level of noise contained in the observations, the algebraic equation (A3) is ill-posed and needs to be solved by a rotation matrix regularization method (Chu et al. [9]) that provide:
a. Stability (robustness) even for data with high noise.
b. The ability to filter out errors with a-priori unknown statistics. Interested readers are referred to [7-12].
Acknowledgment
The Office of Naval Research and the Naval Postgraduate School supported this study.
Gridded FWC Data
- Timmermann M, Latif RV, Grötzner A, Voss R (1998) Northern Hemispheric interdecadal variability: A coupled air-sea mode. Journal of Climate 11(8): 1906-1931.
- Delworth TL, Stouffer RJ, Dixon KW, Spelman MJ, Knutson TR, et al. (2002) Review of simulations of climate variability and change with the GFDL R30 coupled climate model. Climate Dynamics 19(7): 555-574.
- Wood RA, M Vellinga, R Thorpe (2003) Global warming and thermohaline circulation stability. Philosophical Transactions of the Royal Society of London A 361(1810): 1961-1975.
- Phillips H, Wijffels SE (2005) Interannual variability in the freshwater content of the Indonesian-Australian basin. Geophysical Research Letters 32(3).
- Josey SA, Marsh R (2005) Surface freshwater flux variability and recent freshening of the North Atlantic in the eastern subpolar gyre. Journal of Geophysical Research 110(5).
- Boyer TP, S Levitus, JI Antonov , Locarnini RA, Garcia HE (2005) Linear trends in salinity for the World Ocean, 1955-1998. Geophysical Research Letters 32(1).
- Chu PC, Ivanov LM, Korzhova TP, Margolina TM, Melnichenko OM (2003) Analysis of sparse and noisy ocean current data using flow decomposition. Part 1: Theory. Journal of Atmospheric and Oceanic Technology 20: 478-491.
- Chu PC, Ivanov LM, Korzhova TP, Margolina TM, Melnichenko OM (2003) Analysis of sparse and noisy ocean current data using flow decomposition. Part 2: Application to Eulerian and Lagrangian data. Journal of Atmospheric and Oceanic Technology 20: 492-512.
- Chu PC, Ivanov LM, Margolina TM (2004) Rotation method for reconstructing process and field from imperfect data. International Journal of Bifurcation and Chaos 14(8): 2991-2997.
- Chu PC, Ivanov LM, Melnichenko OM (2005) Fall winter current reversals on the Texas-Louisiana continental shelf. Journal of Physical Oceanography 35: 902-910.
- Chu PC, Tokmakian RT, Fan CW, Sun CL (2015) Optimal spectral decomposition (OSD) for ocean data assimilation. Journal of Atmospheric and Oceanic Technology 32: 828-841.
- Chu PC, Fan CW, Margolina T (2016) Ocean spectral data assimilation without background error covariance matrix. Ocean Dynamics 66(9):1143-1163.
- Sun LC, Thresher A, Keeley R, Hall N, Hamilton M, et al. (2009) The data management system for the Global Temperature and Salinity Profile Program (GTSPP). In Proceedings of the “OceanObs’09: Sustained Ocean Observations and Information for Society” Conference (Vol. 2), Venice, Italy, 21-25 September 2009, Hall, J, Harrison D.E. and Stammer, D., Eds., ESA Publication WPP-306.
- Chu PC (2011) Global upper ocean heat content and climate variability. Ocean Dynamics 61(8): 1189-1204.
- Trenberth KT, Fasullo JT, Mackaro J (2011) Atmospheric moisture transports from ocean to land and global energy flows in reanalyes. Journal of Climate 24: 4907-4924.
- Xie P, Janowiak JE, Chen M, Wang W, Shie CL, et al. (2008) Examining fresh water flux over global oceans in the NCEP CDAS, CDAS2, GDAS,GFS, and CFS. Third WCRP International Conference on Reanalysis, the University of Tokyo.

Top Editors
-

Mark E Smith
Bio chemistry
University of Texas Medical Branch, USA -

Lawrence A Presley
Department of Criminal Justice
Liberty University, USA -

Thomas W Miller
Department of Psychiatry
University of Kentucky, USA -

Gjumrakch Aliev
Department of Medicine
Gally International Biomedical Research & Consulting LLC, USA -

Christopher Bryant
Department of Urbanisation and Agricultural
Montreal university, USA -

Robert William Frare
Oral & Maxillofacial Pathology
New York University, USA -

Rudolph Modesto Navari
Gastroenterology and Hepatology
University of Alabama, UK -

Andrew Hague
Department of Medicine
Universities of Bradford, UK -

George Gregory Buttigieg
Maltese College of Obstetrics and Gynaecology, Europe -

Chen-Hsiung Yeh
Oncology
Circulogene Theranostics, England -
.png)
Emilio Bucio-Carrillo
Radiation Chemistry
National University of Mexico, USA -
.jpg)
Casey J Grenier
Analytical Chemistry
Wentworth Institute of Technology, USA -
Hany Atalah
Minimally Invasive Surgery
Mercer University school of Medicine, USA -

Abu-Hussein Muhamad
Pediatric Dentistry
University of Athens , Greece

The annual scholar awards from Lupine Publishers honor a selected number Read More...


