
Lupine Publishers Group
Lupine Publishers
Menu
ISSN: 2637-4676
Review ArticleOpen Access
Unveiling Genetic Potential: Marker-Assisted Selection for Phosphorus Deficiency Tolerant Rice Genotypes Volume 10 - Issue 5
Rishiraj Raghuvanshi1*, Miranda Kongbrailatpam1, Datta P Kakade1, Jyoti Singh1, Vinay Bachkaiya2, S B Verulkar1 and Shubha Banerjee1
- 1Department of Plant Molecular Biology and Biotechnology, Indira Gandhi Krishi Vishwavidyalaya, India
- 2Department of Soil Science and Agricultural chemistry, Indira Gandhi Krishi Vishwavidyalaya, India
Received:July 27, 2023; Published:August 02, 2023
Corresponding author:Rishiraj Raghuvanshi, Department of Plant Molecular Biology and Biotechnology, Indira Gandhi Krishi Vishwavidyalaya, Raipur, Chhattisgarh.492012, India
DOI: 10.32474/SJPBS.2023.10.000348
Abstract
Improving phosphorus (P) use efficiency of indica rice is a major concern of rice breeders. Promising rice genotypes and potential genes contributing phosphorus use efficiency (PUE) in indica rice were identified using marker assisted selection and bulk expression profiling. Segregating population (F3) derived from Sahbhagi Dhan and RRF-78 was evaluated for root traits and yield attributing factors under P-supplemented and P-deficient conditions. The marker RM242 and RM212 were found to be associated to number of tillers/plant and RM212 with plant height in P-deficient condition. Bulk expression profiling of Pup1 QTL underlying genes showed differential expression. Pup1 specific gene OsPupK04-1 showed 2 amplicons of length ~800bp and ~250bp in tolerant and susceptible bulk and in contrasting genotypes, indicating alternate splicing under P-deficiency. The longer fragment was found to be associated with higher Phosphate use efficient rice genotypes. Six recombinant lines SDxRRF-78(63), SDxRRF-78 (83), SDxRRF-78(124), SDxRRF-78(99), SDxRRF-78(26) and SDxRRF-78(81) were identified as P-deficiency tolerant rice genotypes.
Keywords:Phosphorus deficiency tolerance, MAS, Bulk expression in rice
Introduction
Phosphorus (P) is the most essential nutrient after nitrogen. P-deficiency stress is one of the major issues in rice cultivation especially under low input non irrigated farming in India. District wise soil mapping of arable land have shown that about 51% of the soils are having low P content while 40% were medium in P [1]. Moreover, the chemically P fertilizer are made from rock phosphate source which are nonrenewable and are estimated to exhaust very soon [2]. Thus, the identification and development of P-efficient rice cultivar is required with improved root traits, enabling them to better access phosphorus in the soil, or they can have mechanisms to utilize phosphorus more efficiently. Few of the DNA markers-based association studies have also been conducted in last two decades [3-9]. Pup1 QTL is mapped on chromosome 12 of Kasalath that contributes significant P-deficiency tolerance to this landrace. Wissuwa et al. [4] studied P uptake and use efficiency and identified a major quantitative trait locus (QTL) named Pup1 on chromosome 12 of (Kasalath) rice. Further introgression of Pup1 have shown that Nippon bare near-isogenic genotypes having Pup1 could increase phosphate uptake in a severely affected P-deficient plot, relative to the recurrent parent Nippon bare [10]. Fine mapping, sequencing and gene annotation of Pup1 QTL have led to identification of underlying candidate genes (PSTOL1) [4, 11-12]. QTL, Qyd-12 was also indentified by Jewel et al. [13] in P-deficient plot which is co-localized with Pup1 QTL. Combining the QTLs validation and transcriptome profiling approaches have been found more effective in study of genes and genomic regions governing complex traits like P-deficiency tolerance & drought [14]. In this view, in the present study the combination of marker assisted selection (MAS) and expression profiling approaches was used for identification of P-efficient rice genotypes having root trait suitable for higher P-uptake and better P- utilization efficiency depicted by higher yield.
Materials and methods
The experiment was conducted at Department of Plant Molecular Biology & Biotechnology and research cum instructional farm, College of Agriculture, Indira Gandhi Krishi Vishwavidyalaya, Raipur (C.G.), India. (210 16’ N and 810 36’E at altitude of 289.6 meter above sea level).
Population development
Sahbhagi Dhan and RRF-78 were crossed in order to develop phosphorus efficient rice genotype. The genotype RRF-78 has been reported to have P-deficiency responsive modification in root traits (increased root volume and surface area) and relatively lower yield penalty. While Sahbhagi Dhan (IR743l71-70-1-1) is the drought stress tolerant rice variety with high yield released for cultivation under unirrigated conditions in India by IRRI.
Field screening
The 148 F3 segregating lines were evaluated in P-supplemented and P-deficient plots derived from Sahbhagi Dhan and RRF-78. Seedlings were transplanted in the P-supplemented and P-depleted sick plot (P2O5 level 7.00 Kg per hectare having 6.8 pH). The observation of phenotypic parameters viz. plant height 45 days after transplanting (DAT), total number of tillers per plant (45 DAT), number of panicles per plant (60 DAT), flag leaf length & width, biological yield, grain yield was recorded in five replications in both conditions.
Genotyping with SSR and Pup1 sequence specific marker
DNA was extracted from fresh leaf with of Mini Prep method [15]. PCR was done in a total volume of 20μl and the reaction contained (10 X PCR Assay buffer, 1 mMdNTP mix, 5 pM forward and reverse primers, 50ηg of template DNA and 1unit Taq polymerase in Applied Biosystems thermal cycler) After an initial, denaturation step at 95̊ C for 5 min, the amplification was done for 35 cycles comprising of 1 min each of 94̊C, 55̊C and 72̊C. The final elongation step was extended to 7 min at 72̊C followed by 4̊C. After the PCR amplification was completed, the PCR products were run at 5 % PAGE in a mini-vertical electrophoresis unit. DNA fragments were then stained with ethidium bromide and visualized with a UV trans-illuminator, Bio-Rad XLR+ make. A total 60 SSR and 14 Pup1 QTL specific markers were screened, out of which 17 polymorphic SSR markers were used for genotyping. The bands observed were designated as A, B, and H, where A represents RRF-78 like allele, B represent Sahbhagi Dhan like allele, H represents heterozygous. The phenotypic and genotypic data were used for Single marker analysis for identification of markers associated to P-deficiency tolerant traits.
Bulk expression analysis
Based on field evaluation ten best and ten poor performing RI (Recombinant inbred) lines were selected for expression analysis. These RI lines were grown in hydroponics using modified Yoshida nutrient solution [16]. under P-supplemented and P-deficient conditions. The pH of the nutrient solution was maintained at 4.8 to 5.2. Total RNA was extracted from 45 days old plant from root tissue and quantified using nanodrop spectrophotometer. The RNA from the10 best performing RI lines were pooled in equimolar concentration to form tolerant bulk (1micro gram). Similarly, process was followed for susceptible bulk. The cDNA synthesis was done from susceptible and tolerant bulk along with 3 best genotypes (SDxRRF-78(83) SDxRRF-78(81), SDxRRF-78(99), 2 poor performing lines (SDxRRF-78(127) SDxRRF-78(138) and a check (MTU1010) along with Parents. For expression analysis Semi-quantitative PCR was done using five Pup1 QTL co-localized candidate genes [11]. The presence of amplicons and their respective intensity were recorded for characterization of relative gene expression levels.
Statistical analysis
Descriptive statistics and Percent change {(1- P-stress/Pcontrol) *100} was calculated for each trait in both the conditions. Single-marker analysis was done using winQTL Cartographer1.13 [17] for identification of significant markers. It can be conducted using a variety of statistical analyses including t-tests, ANOVA, regression, maximum likelihood & log likelihood ratios.
Results and Discussion
P-deficiency tolerance is a complex phenomenon which is manifested at various levels as changes in whole rice plant [18-19]. Since, most of these traits are also affected by other environmental factors such as water availability, soil type, heat etc. apart from the inherent genetic difference, therefore it has been difficult to characterize the response of a genotype in field level or controlled condition screening alone [20]. Thus, in present study, a combination of field level screening for yield and attributing traits, characterization of root morphological features in root rhizotron experiments and bulk expression profiling for understanding the critical molecular components was used to identify the promising rice genotypes.
Field evaluation under P-deficiency stress
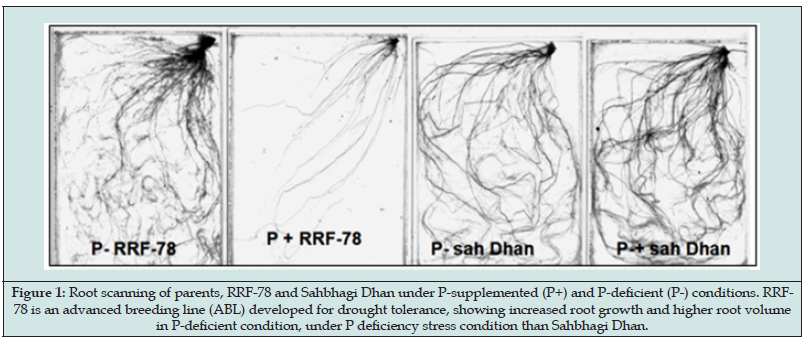
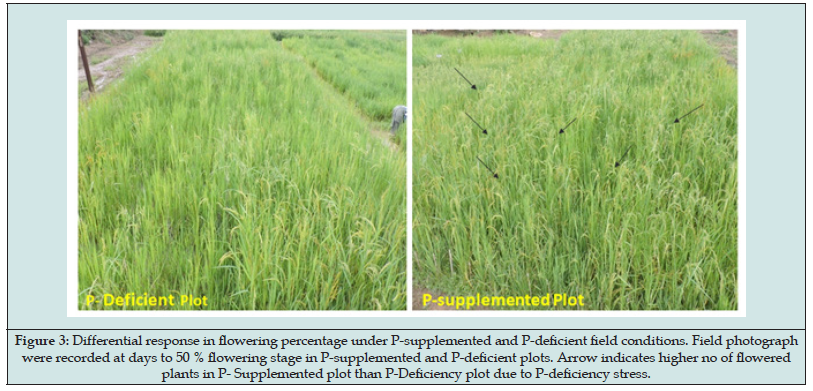
The F3 population developed from cross between Sahbhagi Dhan and RRF-78. Sahbhagi Dhan is the released variety for direct seeded un-irrigated condition and RRF-78, advanced breeding line (ABL) developed for drought tolerance. Although both the parents, Sahbhagi Dhan and RRF-78 are developed for direct seeded low water input cultivation but the genotypes have reported to show differential response under P-deficiency stress. Particularly delay in flowering, reduced yield have been observed in Sahbhagi Dhan while the ABL RRF-78 showed P-deficiency responsive enhancement in root volume and surface area (Figure 1). P-deficiency stress is known to be intensified under water stress therefore population was developed with variety, Sahbhagi Dhan, that has better yield under unirrigated condition. The field evaluation of the F3 population (148 RILs) was done in the wet season, in the P-deficient sick plot with ~7.00 kg P2O5. Phenotypic traits that are known to be affected by abiotic stresses were recorded under both the conditions (Table 1). Among all traits studied, highest reduction of 24.04% was observed in biomass followed by plant height (19.15%) and number of panicle/plant (17.3%) indicating significant effect of P-deficiency stress on these three traits in rice (Figure 2). These 3 traits were thus considered more informative for field screening and selection of P-deficiency tolerant plants [18-19]. Hung [21] have also reported that tillering ability is the suitable morphological marker to screen phosphorus deficient tolerant rice genotype. However, in our study we observed non-significant decrease in average number of tillers per plant (NOT) under P-supplemented (8.28) and P-stress (7.25) conditions (Table 1). Thus, an average reduction of 7.63 % was observed. Compared to NOT a higher reduction in number of effective tillers (reproductive tillers bearing panicles) was recorded i.e., 17.3% which again suggested importance of phosphorus for reproductive growth phase in plants. Delay in flowering (Figure 3) in almost all plants in the population was observed under P-deficiency stress which ranged from 2-5 days. Therefore, reduced plant, height, delay in flowering and reduced number of reproductive tillers were found to be important for screening out of the susceptible rice genotypes.
PHT: plant height; NOT: No. of tillers; NOP: No. of panicle; FLL: Flag leaf length; FLW: Flag Leaf Width; BY: Biological Yield; GY: Grain Yield; HI: Harvest Index; P+, P-supplemented; P-, P-stress; SE, P-1(SD), Sahbhagi Dhan; P-2(R), RRF-78 standard error, SD; standard deviation, Min; minimum, Max, maximum.
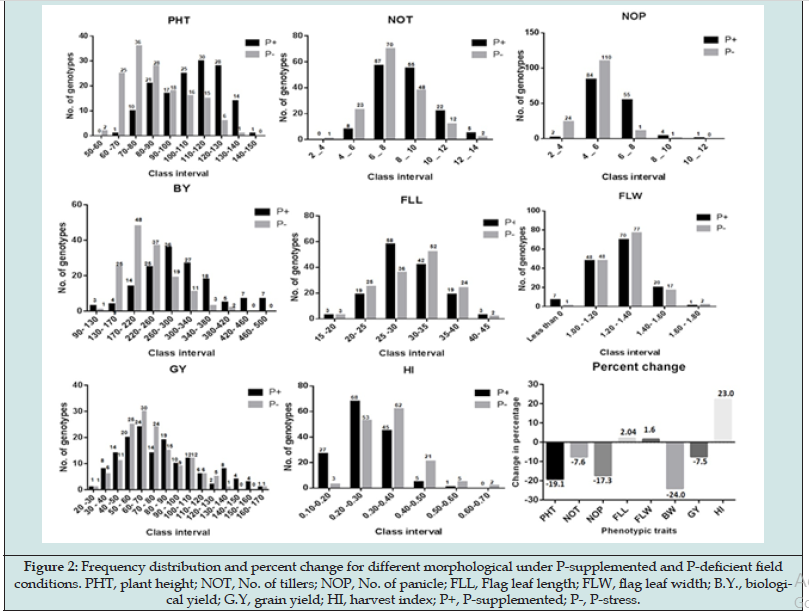
Similarly, relative number of tillers (ratio of tillers in stress and control conditions) under P-deficient condition has been reported as an important character to quantify P-deficient tolerance genotype in rice [22-23] but as per our observations the relative values of relative biomass and number of panicle (NOP) provide a better index for screening and identifying rice plant tolerant to P-deficiency stress. To assess the effect of P-deficiency stress on flag leaf observation were recorded at 60 days after transplanting (DAT). Our study indicated non-significant change in the flag leaf length (FLL) and width (FLW) with -0.02 & +0.01 percent change respectively indicating that FLL and FLW are not affected by P-deficiency stress. Reduction in the biomass under P-deficiency stress has been reported [24-26] and biological yield is thus considered as important trait for screening of P-deficiency tolerance genotype. An average reduction of 24.04 % was observed. The RILs having lesser reduction in biomass in comparison to supplemented P-condition were thus considered tolerant to P-deficiency stress.
P is an essential macro nutrient for plants that has a major role in influencing yield when deficient [27-28]. Our observations for grain yield in the segregating population showed an average of 79.36 gm under P supplemented condition which was reduced to 72.9 gm in P-deficient condition. Although the reduction of 7.5 % was significant but is lesser than biological yield indicating that the rice plants tend to maintain grain yield under stress. Apart from population mean values the individual F3 lines showed significant effect of P-deficiency stress as depicted by change in the grain yield per plant as shown in graphs of grain yield (Figure 2). It was observed that several RI lines belonging to the higher grain yield classes (120 gm/plant and above) were shifted to lower grain yield classes (120gm and lower). The grain yield data thus showed that the grain yield penalty was more in higher yielding genotypes as compared to moderate or poor yielding genotypes. The high yielding lines that either showed no significant change in grain yield or very less reduction was thus classified as tolerant genotypes. The harvest index (HI) was found to be relatively higher in P-deficiency stress than the supplemented condition with -0.22 percent reduction. Grasses tend to shift to flowering phase as an escape response to abiotic stress thus early flowering is observed in many rice varieties native to problem soils. This earliness or escape is usually accompanied with the yield penalty and is not the true reflection of better P use efficiency. An increase in HI is expected due to reduction in biomass as observed in most of the genotypes. Therefore, the RI lines that were able to maintain their biomass, number of tillers and panicles per plant along with non-significant reduction in grain yield were selected.
Marker identification and validation
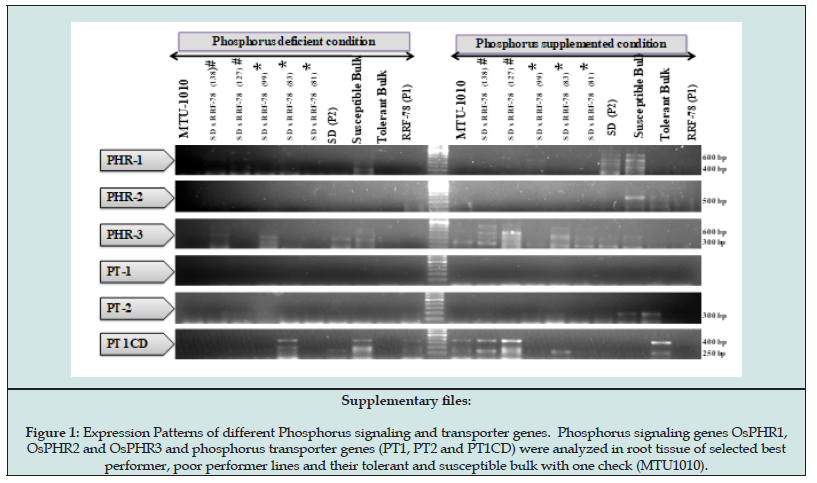
60 QTL linked RM markers were used for genotyping of the F3 population (Supplementary file1) along with the 14 markers developed from Pup1 QTL region. Both the parent derived from japonica and indica genetic base thus both the genotypes were found to be Pup1 haplotypes showing Pup1 alleles in all 14 markers but their response to P-deficiency stress varied significantly. P-deficiency stress responsive stimulation in root growth leading to higher root volume and surface area was observed in RRF- 78, while non-significant effect was observed in Sahbhagi Dhan ( Supplementary Figure 1). The observations indicated the interaction of genetic background on the phenotype of Pup1 QTL and also suggested that different mechanism may operate under P-deficiency which influences the performance of the genotype. Previous studies conducted on these parents have also indicated that both the parents (Sahbhagi Dhan and RRF-78) are pup1 haplotypes however they showed different performance under P-deficiency stress [29-30]. Out of 60 RM markers, 17 RM markers exhibited parental polymorphism and were subsequently used to generate the genotypic data whereas all 14 Pup1 specific marker were found to be monomorphic hence they were not used for genotyping. Single Marker Analysis was done for 17 polymorphic markers and identified associated markers under both the conditions (Table 2).
PHT: plant height; NOT: No. of tillers; NOP: No. of panicle; FLL: Flag leaf length; FLW: flag leaf width; BY: Biological Yield; GY: Grain Yield; P+, P-supplemented ; P-, P-deficient conditions; Ch, chromosome no.; pr(F) P value, *, **, *** and**** = level of significance at 5%, 1%, 0.1% and 0.01% respectively; R2 , coefficient of determination
Markers RM212 on Ch#01 and RM447 on Ch#8 were found to be significantly associated with plant height under P-supplemented condition whereas RM237 on Ch#2 and RM212 on Ch#01 were found to be associated with plant height under P-deficient condition. Gomez et al. [31]. also reported for QTL for plant height on chromosome no. 1, 4, 5 by using recombinant inbred (RI) lines of Bala × Azucena. Similarly, several minor QTLs for plant height have been identified on chromosome no 1, 2, 4, 7, 8, and 9 under control and water stress conditions in cross derived from CT9993-5-10-1-M/ IR62266-42-6-2 [32]. Minor QTLs related to P-deficiency stress tolerance have been identified on chromosome 1, 6 and 9 under [12]. In our study also, the marker RM152 on Ch#8 and RM242 on Ch#9 were found to be significantly associated to number of tillers in P-deficiency stress. For P-deficiency stress the marker RM242 has been found associated with number of panicles per plant and plant height under P-deficiency stress [33]. The same marker has been reported as a linked marker for root trait under drought stress [34]. The number of tillers per plants is an important trait for characterizing drought tolerance also, as indicated by QTLs identified on chromosome 1, 3 for the trait under drought stress [31]. Tillering ability reflects significant GXE interaction and is influenced by most of the abiotic stresses like water stress, nutrient deficiency, heat etc. Therefore, the F3 genotypes showing higher number of tillers under P-deficiency stress or lesser reduction in number of tillers in relation to P-control are the promising candidate genotypes for un-irrigated cultivation conditions.
The F3 RI lines SDxRRF-78(63), SDxRRF-78(83), SDxRRF-78(124), SDxRRF-78(99), SDxRRF-78(26) and SDxRRF-78(81) were thus identified (Table 3). The number of panicles is also an important trait contributing to yield potential of a genotype. In present study RM71 on Ch# 2 and RM408 on Ch# 8 were found to be significantly associated with number of panicles per plant under P-supplemented condition but there were no markers found to be associated to the No. of panicles under P-deficiency. Analysis of the FLL and FLW in the F3 RI lines under P-deficiency stress led to identification of markers, RM 413, RM 408, RM242 on Ch# 5,8, 9 respectively, as significantly associated with FLL under P-supplemented condition. Whereas RM212 and RM 447 located on Ch# 1 and 8, were found to be associated to FLL in P-deficiency stress. Gomez et al. [31] reported that RM212 is linked to biological yield under drought stress. The significant association of the linked marker RM212 in our population under P-deficiency stress validates the presence of QTL. Similarly, the markers RM154 on Ch#1 and RM 55 on Ch#8 were found to be significantly associated with FLW under P-supplemented condition and the markers RM152 on Ch#8 and RM242 on Ch#9 in P-deficiency stress (Supplementary Tables 1 & 2).
PHT: plant height; NOT: No. of tillers; NOP: No. of panicle; FLL: Flag leaf length; FLW: flag leaf width; BY: Biological Yield; GY: Grain Yield; P+, P-supplemented condition; P-, P- deficient condition; SDxR, Sahbhagi Dhan (P1) x RRF-78 (P2).
Supplementary Table 1: List of SSR and Pup 1 sequence specific primers were used for parental polymorphism.
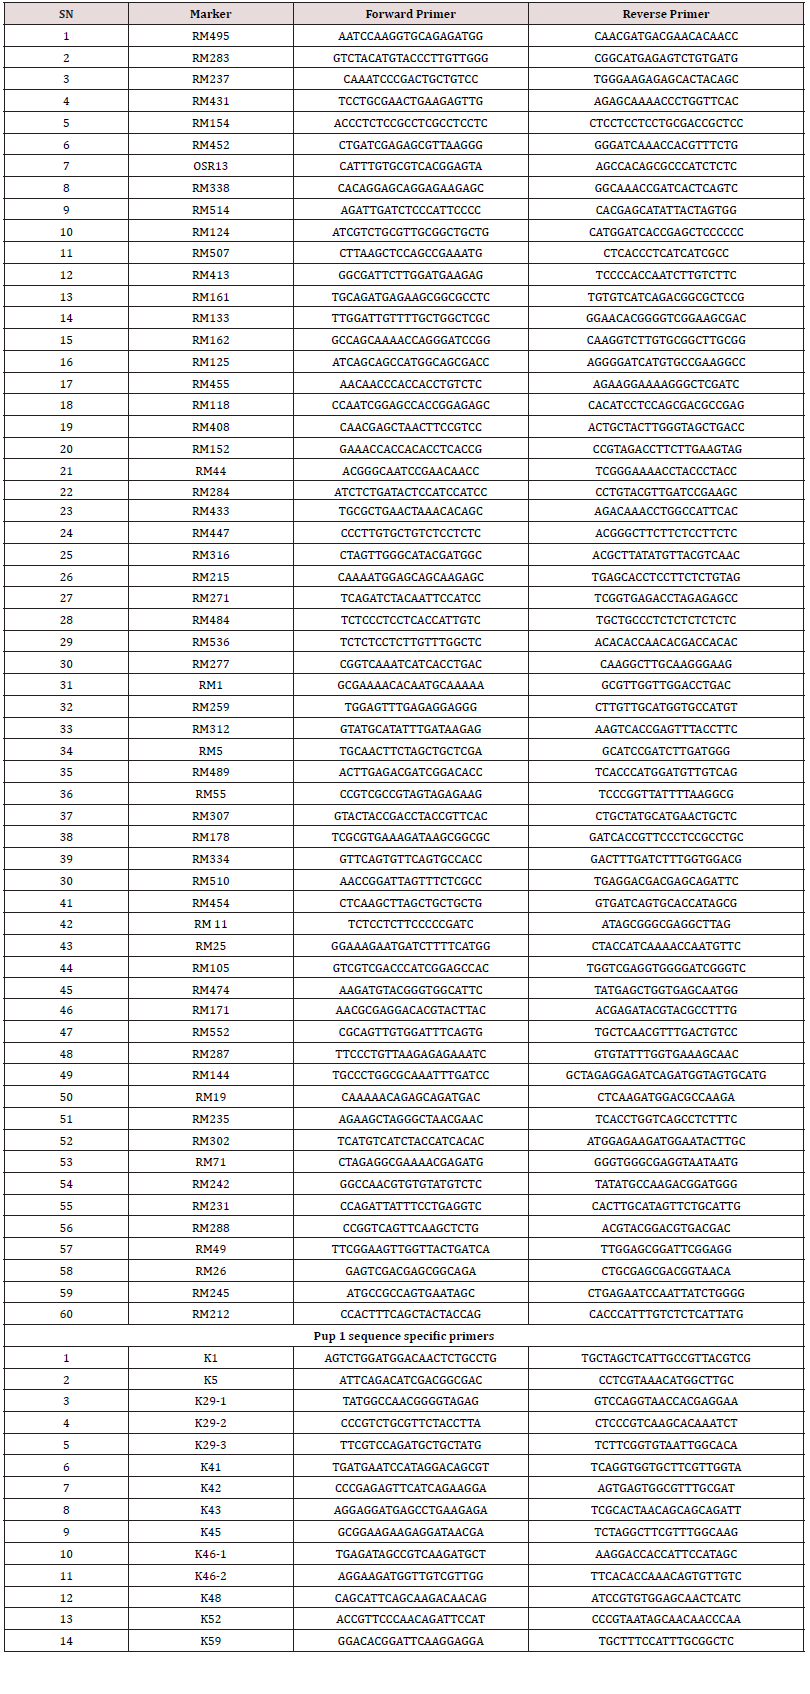
Supplementary Table 2: List of SSR and Pup 1 sequence specific primers were used for parental polymorphism.

The marker RM 71, RM 413, RM 408, RM 152 on Ch# 2, 5, 8, 8 respectively were found to be significantly associated with biological yield under P-supplemented condition whereas no marker was found under P-deficient condition. The marker RM152 was found to be significantly associated with harvest index and grain yield under P-deficiency stress. Grain yield is the ultimate objective in any crop improvement program. Yield reduction by the P-deficiency stress has been reported to be as high as 47%, even without any drought symptoms [35-36]. In this study the markers RM 71, RM152 on Ch# 2,8 respectively were found to be significantly associated with grain yield under P-supplemented condition whereas no marker was found to be significantly associated to grain yield in P-deficient condition. The markers for relative grain yield and biomass under P-deficiency stress will be of substantial importance for the screening of P-deficiency tolerance ability in rice.
Bulk expression analysis of Pup1 QTL co-localized candidate genes

Five genes were used in this study for characterization of expression in rice root tissue under P-supplemented and deficiency stress conditions (Figure 4). The genes OsPupK04-1 and OsPupK05-1 are known to be ubiquitously expressing genes with higher level of expression of OsPupK05-1 under P deficiency [11,26]. The expression pattern of OsPupK04-1 showed differential expression. In our experiment the OsPupK04-1 gene expressed with two different lengths of mRNA under P-supplemented condition in tolerant bulk, SDxRRF-78(83), SDxRRF-78(99) (800bp) and susceptible bulk (250bp), parents (250bp) and check genotype MTU1010 (250bp) (Figure 4). With onset of phosphorus deficiency stress the 800 bp mRNA transcript was observed in both tolerant and susceptible bulk, best and poor performing genotypes, SDxRRF-78(83), SDxRRF-78(81), check genotype MTU1010 and both the parents, with different level of expressions. This indicated that the gene might be alternatively spliced for regulation of P-uptake in rice roots. Still the higher intensity of 800 bp band in tolerant bulk, better root trait parent RRF-78, and better performing genotypes SDXRR-78(83) and SDXRR78 (81) while very low level of expression in Sahbhagi Dhan (water stress tolerant variety) suggested differential regulation of the gene is correlated to the growth of root in response to P-deficiency stress in rice. The results indicated that either two copies of genes are present in tolerant and susceptible lines or there is post transcriptional modification occurring more efficiently in tolerant genotype under P deficient condition.
The Pup1 gene model described by Chin et al. [11] also suggested that OsPupK05 may be independent gene or it may represent a spliced variant of OsPupK04-1. The presence of two amplicons for the same primer set obtained in our study indicated that OsPupK05 gene model proposed is actually a spliced variant of OsPupK04-1 and not an independent gene. The functional marker (K5) located within OsPupK05 is therefore a potential target for marker assisted selection strategy. In a parallel study carried in our lab with 177 diverse rice genotypes of different genetic background, it was found that the K5 marker has been found significantly associated to number of tillers per plant and grain yield under P-deficient condition [33]. Thus, the K5 marker and the OsPupK04-1 gene may be further analyzed for development for functional markers capable of screening and identification of indica rice genotypes having higher P uptake efficiency in deficient soils. The OsPupK20-2 is known supplemented to encode divergent protein, putative, expressed (LOC_Os12g26380) [11], but in our study no expression of this gene was observed in all ten samples under P-supplemented condition. The gene however expressed at significant high level in 3 P-deficiency susceptible genotypes, check genotype MTU1010 and susceptible bulk (faint expression) suggesting role of OsPupK20-2 in P-starvation sensing or signaling mechanism. Up-regulation of OspupK20-2 in genotypes susceptible to P-deficiency stress showed its association with susceptibility. The OsPupK29, that codes for a hypothetical protein and having high but partial similarity to two expressed protein genes (Os12g26390 and 12g26410) in the Nippon bare reference genome [10], showed higher expression in all the genotypes and both tolerant and susceptible bulk in P-supplemented condition.
Similar to the OsPupK20-2 the expression of OsPupK29 was found to be down-regulated in all the tolerant genotypes and tolerant bulk but high level of expression was observed in P-deficiency susceptible genotypes, check MTU1010 and susceptible bulk with very low level of expression. The results thus suggested that the gene OsPupK29-1 expression is also associated to susceptibility in terms of yield under P-stress response. OsPupK46-2 gene expressed at equal level in all the genotypes as well as tolerant and susceptible bulk and parent under both conditions. Although it was down regulated in RRF-78 under P-deficiency stress but non-significant effect was observed in the tolerant and susceptible bulk. The results indicated that non- significance correlation between the level of expression of the gene and response of genotypes to P-deficiency stress. OsPupK67-1 is reported to be similar to aspartic proteinase precursor nepethesin-1 precursor LOC_Os12g262470) [11]. Data showed that there is slight up-regulation of OsPupK67-1 genes except RRF-78 and one best performance line (SDxRRF-78(81) under P-supplemented condition but onset of P-deficiency down regulation was observed except RRF-78 and one best performance lines SDxRRF-78(81) the data showed that there were two tolerant genotypes showing slight up-regulation under P-deficiency stress only which suggested that there was positively correlation between genotypes and P-deficiency stress, however the intensity of expression was low in both the conditions.
Conclusion
The combined approach led to identification of six RILs, SDxRRF-78(63), SDxRRF-78(83), SDxRRF-78(124), SDxRRF-78(99), SDxRRF-78(26) and SDxRRF-78(81) as the promising tolerant genotypes that showed highest number of tillers per plant and least reduction in number of effective tillers (panicles) per plant as well as highest yielder among 148 lines under P-deficiency condition. The Pup1 colocalized gene, OsPupK04-1, showed two distinct amplicons (800 and 250 bp) in tolerant and susceptible bulk indicating alternatively splicing of this gene under P-deficiency stress. The sequencing of the amplicons is in process to understand the gene regulation in these genotypes and its functional significance. The marker RM242 and RM212 were found to be associated to number of tillers/plant and number of tillers as well as plant height in P-deficient condition thus validating the presence of the corresponding QTLs in our population.
Funding
This research was funded by the Chhattisgarh Council of Science and Technology as Mini Research Project (MRP) Grant and the partial supported by Indira Gandhi Krishi Vishwavidyalaya, Raipur, India.
References
- Muralidharudu Y, Reddy KS, Mandal BN, Rao AS, Singh KN, et al. (2011) GIS based soil fertility maps of different states of India. Indian Institute of Soil Science.
- Cordell D, White S (2011) Peak phosphorus: clarifying the key issues of a vigorous debate about long-term phosphorus security. Sustainability 2027-49 3(10).
- Wissuwa M, Ae N (2001) Further characterization of two QTLs that increase phosphorus uptake of rice (Oryza sativa L.) under phosphorus deficiency. Plant Soil 237: 275-286.
- Wissuwa M, Wegner J, Ae N, Yano M (2002) Substitution mapping of Pup1: a major QTL increasing phosphorus uptake of rice from a phosphorus-deficient soil. Theoretical and Applied Genetics 105(6-7):890-897.
- Zhang YJ, Dong YJ, Zhang JZ, Xiao K, Xu JL, Terao H (2006) 14. Mapping QTLs for deficiency phosphorus response to root-growth of rice seedling.
- Chin JH, Lu X, Haefele SM, Gamuyao R, Ismail A, et al. (2010) Development and application of gene-based markers for the major rice QTL Phosphorus uptake 1. Theoretical and Applied Genetics. Apr 120(6):1073-1086.
- Chin JH, Gamuyao R, Dalid C, Bustamam M, Prasetiyono J, et al. (2011) Developing rice with high yield under phosphorus deficiency: Pup1 sequence to application. Plant physiology 156(3):1202-1216.
- Deng Y, Men C, Qiao S, Wang W, Gu J, et al. (2020) Tolerance to low phosphorus in rice varieties is conferred by regulation of root growth. The Crop Journal 8(4): 534-547.
- Roy S, Verma B C, Banerjee A, Kumar J, Ray U S, et al. (2021) Genetic diversity for drought and low-phosphorus tolerance in rice (Oryza sativa L.) varieties and donors adapted to rainfed drought-prone ecologies. Scientific Reports 11(1): 13671.
- Heuer S, Lu X, Chin JH, Tanaka JP, Kanamori H, et al. (2009) Comparative sequence analyses of the major quantitative trait locus phosphorus uptake 1 (Pup1) reveal a complex genetic structure. Plant Biotechnology Journal 7(5): 456-471.
- Gamuyao R, Chin JH, Pariasca Tanaka J, Pesaresi P, Catausan S, et al. (2012) The protein kinase Pstol1 from traditional rice confers tolerance of phosphorus deficiency. Nature 488(7412):535-539.
- Ni JJ, Wu P, Senadhira D, Huang N (1998) Mapping QTLs for phosphorus deficiency tolerance in rice (Oryza sativa L.). Theory Appl Genet 97: 777–783.
- Jewel ZA, Ali J, Mahender A, Hernandez J, Pang Y, et al. (2019) Identification of quantitative trait loci associated with nutrient use efficiency traits, using SNP markers in an early backcross population of rice (Oryza sativa L.). International journal of molecular sciences 20(4):900.
- Zhang D, Zhang D, Zhang H, Li H, Chi Y, et al. (2016) Integrating QTL mapping and transcriptomics identifies candidate genes underlying QTLs associated with soybean tolerance to low-phosphorus stress. Plant Molecular Biology 93: 137-150.
- Doyle JJ, Doyle JL (1987) A rapid DNA isolation procedure for small quantities of fresh leaf tissue. Phytochemical Bulletin 19: 11-15.
- Yoshida S, Forno DA, Cock JH, Gomez KA (1976) Laboratory manual for physiological studies of rice. 3rd ed., The International Rice Research Institute Press. Manila. Philippines.
- Basten CJ, Weir BS, Zeng ZB (1999) QTL Cartographer, version 1.13. Department of Statistics, North Carolina State University, Raleigh, NC.
- Deng Y, Men C, Qiao S, Wang W, Gu J, et al. (2020) Tolerance to low phosphorus in rice varieties is conferred by regulation of root growth. The Crop Journal 8(4): 534-547.
- Bhatta BB, Panda RK, Anandan A, Pradhan NSN, Mahender A, et al. (2021) Improvement of phosphorus use efficiency in rice by adopting image-based phenotyping and tolerant indices. Frontiers in plant science 12: 717107.
- Vinci G, Ruggieri R, Ruggeri M, Prencipe SA (2023) Rice Production Chain: Environmental and Social Impact Assessment-A Review. Agriculture 13(2): 340.
- Hung HH (1985) Studies on tillering ability of rice under phosphorus stress. PhD thesis A and M University Texas, USA pp: 4-7.
- Gao F, Lu X, Kang H, Sun S, Liu G, et al. (2006) Screening and identification for rice (Oryza sativa L.) tolerance to P-deficiency at seedling stage. Acta Agronomica Sinica 32: 1151-1155.
- Ablede KA, Koudjega K, Lawson IYD, Abekoe MK, Owusu Bennoah E (2021) Phosphorus adsorption, rice dry matter yield, and P use efficiency as influenced by phosphorus fertilizer rates in rainfed lowland soils in Togo. West African Journal of Applied Ecology 29(1): 1-12.
- Alam MM, Ali MH, Amin AK, Hasanuzzaman M (2009) Yield attributes, yield and harvest index of three irrigated rice varieties under different levels of phosphorus. Advances in biological research 3(3-4): 132-139.
- Irfan M, Aziz T, Maqsood MA, Bilal HM, Siddique KH, et al. (2020) Phosphorus (P) use efficiency in rice is linked to tissue-specific biomass and P allocation patterns. Scientific reports 10(1): 4278.
- Ewona E, Chukwurah PN, Ita EE, Ntui VO, Opara C, et al. (2022) Screening for phosphate deficiency tolerance and expression of phosphate uptake genes in Nigerian local rice landraces. African Journal of Biotechnology 21(10): 472-482.
- Lynch JP (2007) Roots of the second green revolution. Australian Journal of Botany 55: 493-512.
- Kumar S, Kumar S, Mohapatra T (2021) Interaction between macro‐and micro-nutrients in plants. Frontiers in Plant Science 12: 665583.
- Gupta A, Kakade DP, Singh J, Janjal PH, Verulkar SB, et al. (2016) Characterization of Rice Root Transcriptome under Phosphorus Deficiency Stress. International Journal Current Microbiology Applied Sciences 5: 273-279.
- Kakade DP, Singh J, Wallalwar MR, Janjal A, Gupta A, et al. (2017) Differential response of root morphology of rice (Oryza sativa L.) genotypes under different phosphorus conditions. Int J Curr Microbiol App Sci 6(7): 149-160.
- Gomez MS, Kumar SS, Jeyaprakash P, Suresh R, Biji KR, et al. (2006) Mapping QTLs linked to physio-morphological and plant production traits under drought stress in rice (Oryza sativa L.) in the target environment. American Journal of Biochemistry and Biotechnology 2(4): 161-169.
- Babu RC, Nguyen BD, Chamarerk V, Shanmugasundaram P, Chezhian P, et al. (2003) Genetic analysis of drought resistance in rice by molecular markers. Crop Science 43(4): 1457-1469.
- Kongbrailatpm M (2017) Identification of DNA markers associated to phosphorous use efficiency in indica rice genotypes. M.Sc. Thesis IGKV Raipur pp: 1-154.
- Chavan NR (2016) Identification of candidate gene and closely linked Marker for root traits in rice. (Oryza Sativa L.) Ph.D. Thesis IGKV Raipur pp: 7-247.
- Kato Y, Tajima R, Toriumi A, Homma K, Moritsuka N, et al. (2016) Grain yield and phosphorus uptake of rainfed lowland rice under unsubmerged soil stress. Field crops research 190: 54-59.
- Rakotoson T, Tsujimoto Y, Nishigaki T (2022) Phosphorus management strategies to increase lowland rice yields in sub-Saharan Africa: A review. Field Crops Research 275: 108370.

Top Editors
-

Mark E Smith
Bio chemistry
University of Texas Medical Branch, USA -

Lawrence A Presley
Department of Criminal Justice
Liberty University, USA -

Thomas W Miller
Department of Psychiatry
University of Kentucky, USA -

Gjumrakch Aliev
Department of Medicine
Gally International Biomedical Research & Consulting LLC, USA -

Christopher Bryant
Department of Urbanisation and Agricultural
Montreal university, USA -

Robert William Frare
Oral & Maxillofacial Pathology
New York University, USA -

Rudolph Modesto Navari
Gastroenterology and Hepatology
University of Alabama, UK -

Andrew Hague
Department of Medicine
Universities of Bradford, UK -

George Gregory Buttigieg
Maltese College of Obstetrics and Gynaecology, Europe -

Chen-Hsiung Yeh
Oncology
Circulogene Theranostics, England -
.png)
Emilio Bucio-Carrillo
Radiation Chemistry
National University of Mexico, USA -
.jpg)
Casey J Grenier
Analytical Chemistry
Wentworth Institute of Technology, USA -
Hany Atalah
Minimally Invasive Surgery
Mercer University school of Medicine, USA -

Abu-Hussein Muhamad
Pediatric Dentistry
University of Athens , Greece

The annual scholar awards from Lupine Publishers honor a selected number Read More...


